

Grafana Cloud is a fully managed observability platform that provides visualization, alerting, and analytics for your telemetry data. By exporting your Cloudflare Workers telemetry to Grafana Cloud, you can:
- Visualize distributed traces in Grafana Tempo to understand request flows and performance bottlenecks
- Query and analyze logs in Grafana Loki alongside your traces
This guide will walk you through configuring Cloudflare Workers to export OpenTelemetry-compliant traces and logs to your Grafana Cloud stack.
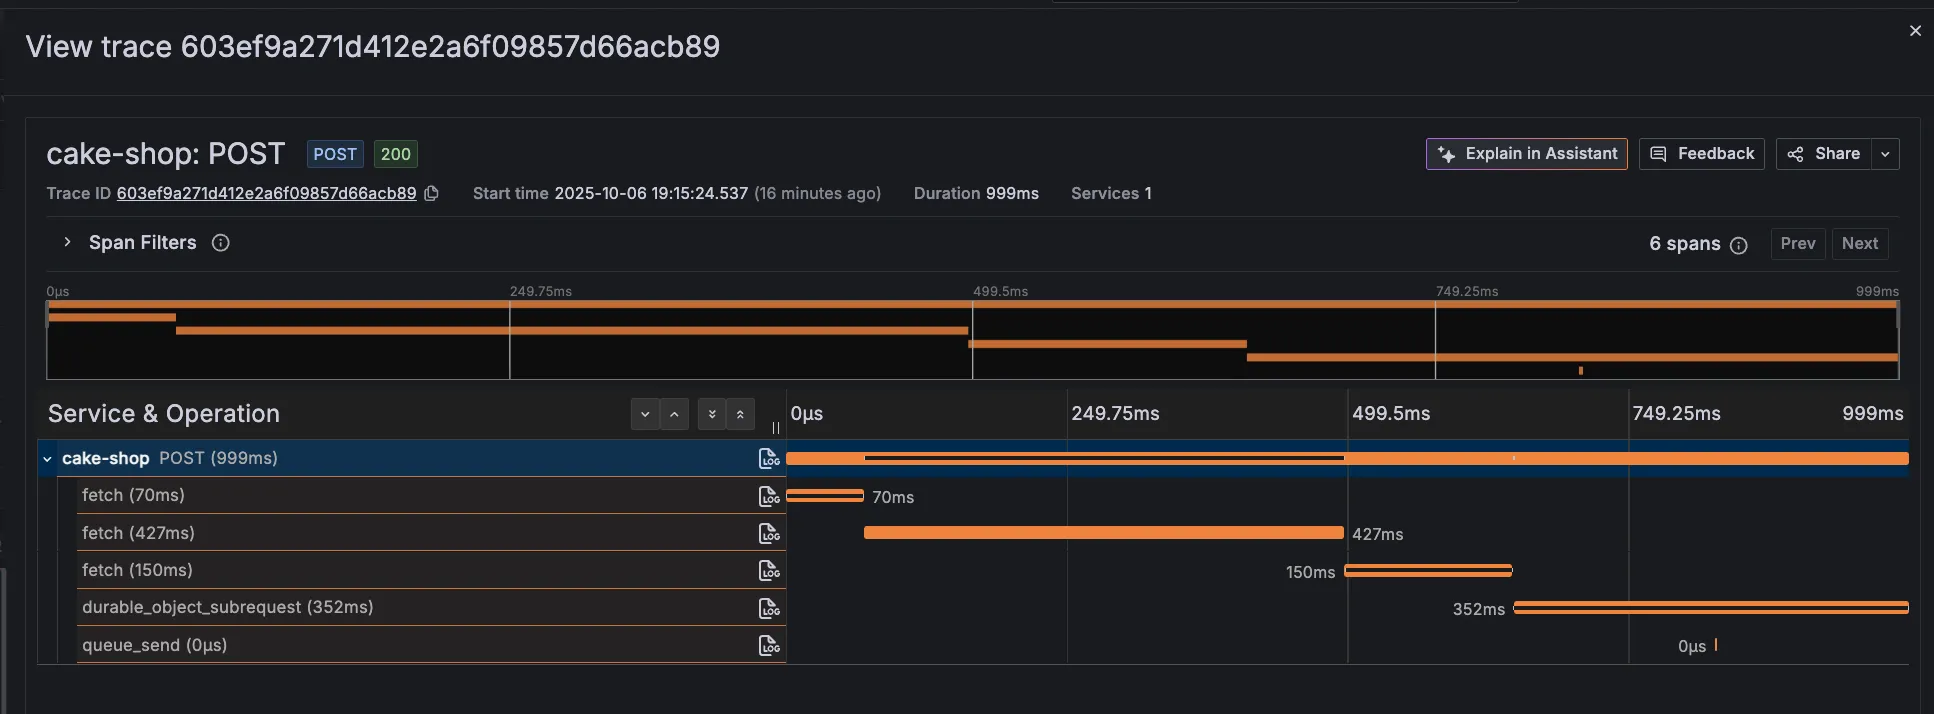
Before you begin, ensure you have:
- An active Grafana Cloud account ↗ (free tier available)
- A deployed Worker that you want to monitor
- Log in to your Grafana Cloud portal ↗
- From your organization's home page, navigate to Connections → Add new connection
- Search for "OpenTelemetry" and select OpenTelemetry (OTLP)
- Select Quickstart then select JavaScript
- Click Create a new token
- Enter a name for your token (e.g.,
cloudflare-workers-otel) and click create token - Click on Close without copying the token
- Copy and Save the value for
OTEL_EXPORTER_OTLP_ENDPOINTandOTEL_EXPORTER_OTLP_HEADERSin theEnvironment variablescode block as the OTel endpoint and as the Auth header value respectively
- Navigate to your Cloudflare account's Workers Observability ↗ section
- Click Add destination and configure a destination name (e.g.
grafana-tracing) - From Grafana, copy your Otel endpoint, auth header, and auth value
- Your OTEL endpoint will look like
https://otlp-gateway-prod-us-east-2.grafana.net/otlp(append/v1/tracesfor traces and/v1/logsfor logs) - Your custom header should include:
- Your auth header name
Authorization - Your auth header value
Basic MTMxxx...
- Your auth header name
With your destination created in the Cloudflare dashboard, update your Worker's configuration to enable telemetry export.
{
  "observability": {
    "traces": {
      "enabled": true,
      // Must match the destination name in the dashboard
      "destinations": ["grafana-traces"]
    },
    "logs": {
      "enabled": true,
      // Must match the destination name in the dashboard
      "destinations": ["grafana-logs"]
    }
  }
}[observability.traces]
enabled = true
destinations = [ "grafana-traces" ]
[observability.logs]
enabled = true
destinations = [ "grafana-logs" ]After updating your configuration, deploy your Worker for the changes to take effect.