

Cloudflare Workers supports exporting OpenTelemetry (OTel)-compliant telemetry data to any destination with an available OTel endpoint, allowing you to integrate with your existing monitoring and observability stack.
You can export the following types of telemetry data:
- Traces - Traces showing request flows through your Worker and connected services
- Logs - Application logs including
console.log()output and system-generated logs
Note: exporting Worker metrics and custom metrics is not yet supported.
Below are common OTLP endpoint formats for popular observability providers. Refer to your provider's documentation for specific details and authentication requirements.
| Provider | Traces Endpoint | Logs Endpoint |
|---|---|---|
| Honeycomb | https://api.honeycomb.io/v1/traces |
https://api.honeycomb.io/v1/logs |
| Grafana Cloud | https://otlp-gateway-{region}.grafana.net/otlp/v1/traces |
https://otlp-gateway-{region}.grafana.net/otlp/v1/logs[^1] |
| Firetiger ↗ | https://ingest.cloud.firetiger.com/v1/traces |
https://ingest.cloud.firetiger.com/v1/logs |
| Axiom | https://api.axiom.co/v1/traces |
https://api.axiom.co/v1/logs |
| Sentry | https://{HOST}/api/{PROJECT_ID}/integration/otlp/v1/traces |
https://{HOST}/api/{PROJECT_ID}/integration/otlp/v1/logs |
| PostHog | Not supported | https://{REGION}.i.posthog.com/i/v1/logs |
| Datadog ↗ | Coming soon, pending release from Datadog | https://otlp.{SITE}.datadoghq.com/v1/logs |
| New Relic ↗ | https://otlp.nr-data.net/v1/traces |
https://otlp.nr-data.net/v1/logs |
| Splunk Observability ↗ | https://ingest.{REALM}.signalfx.com/v2/trace/otlp |
N/A |
| Splunk Platform ↗ | http://splunk.internal:4318/v1/traces |
http://splunk.internal:4318/v1/logs |
To start sending data to your destination, you'll need to create a destination in the Cloudflare dashboard.
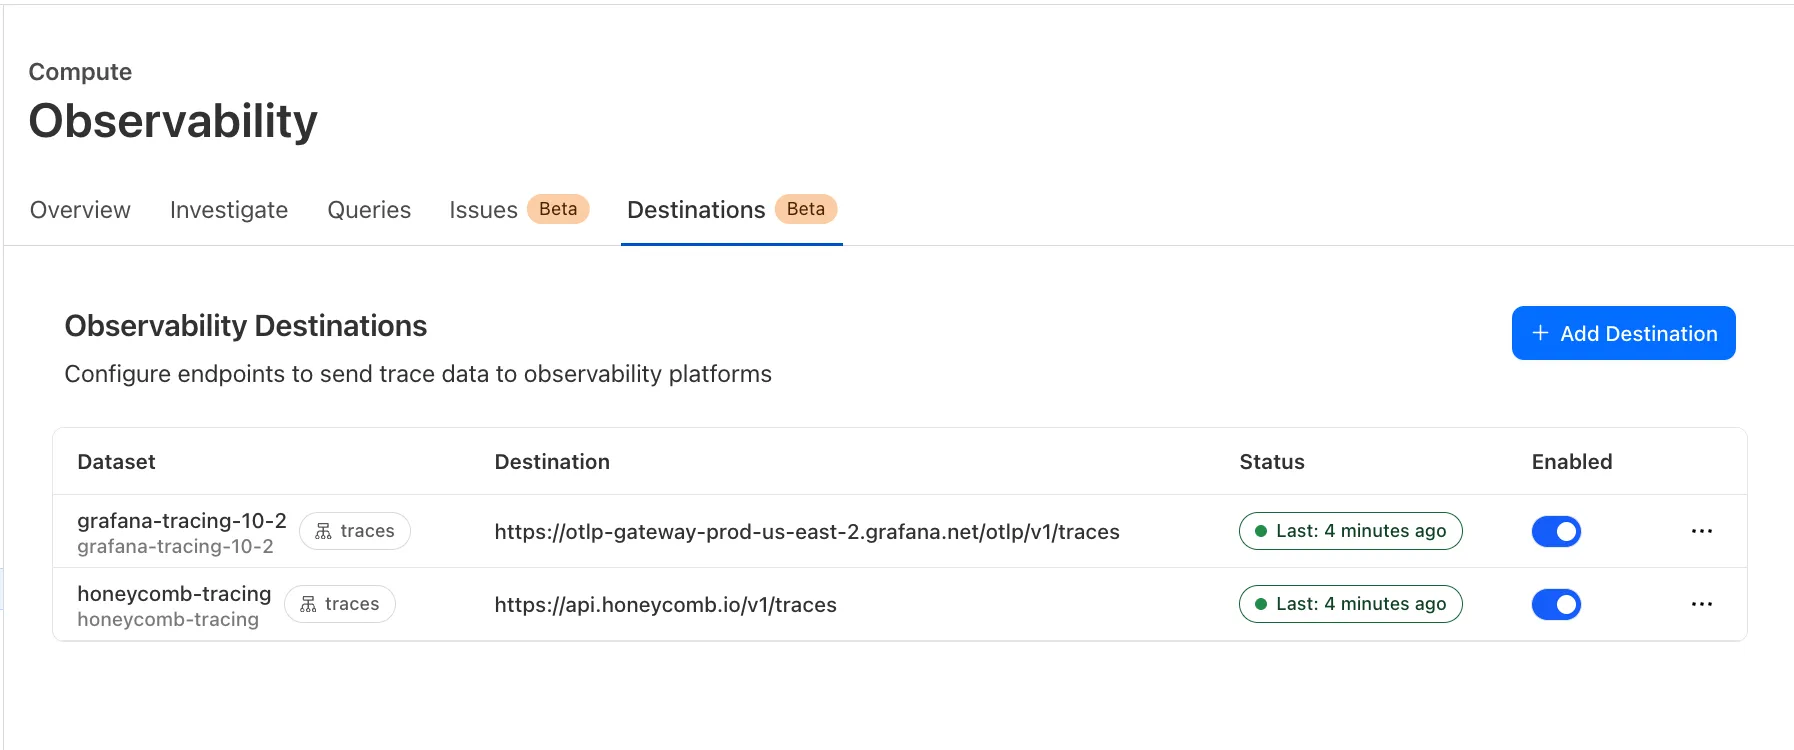
- Head to your account's Workers Observability ↗ section of the dashboard
- Click add destination.
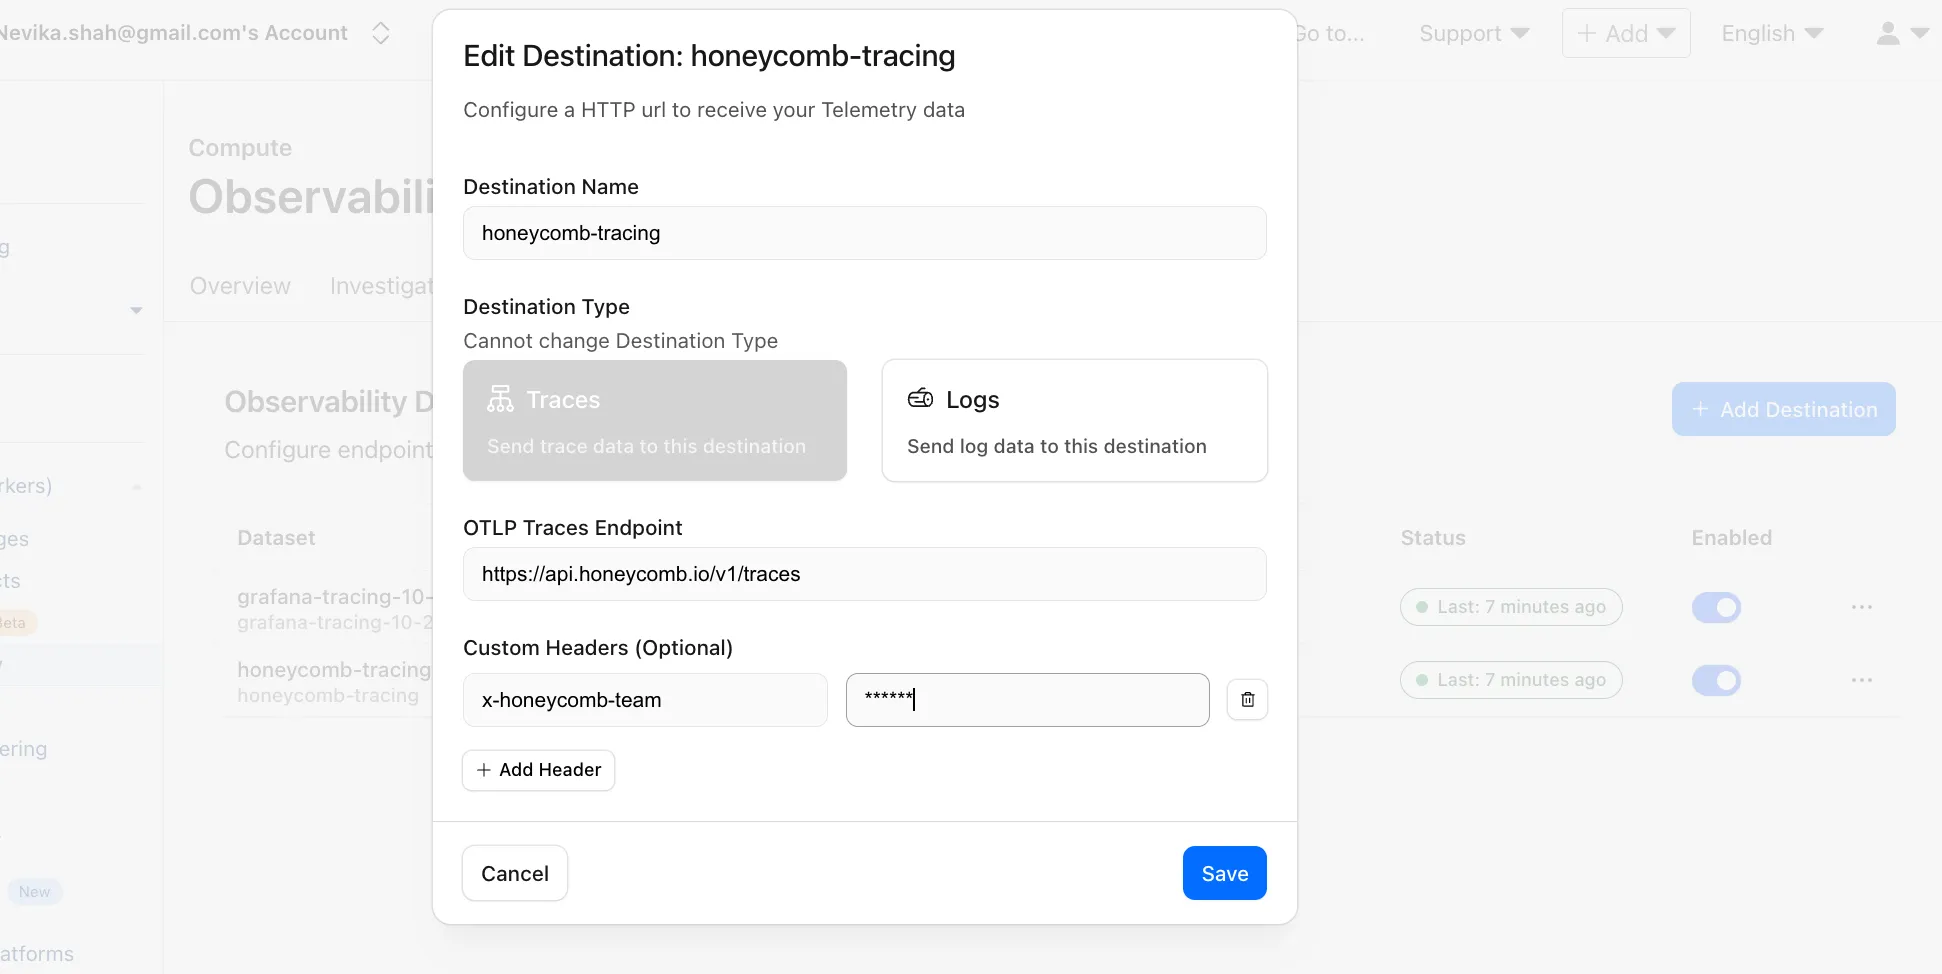
- Configure your destination:
- Destination Name - A descriptive name (e.g., "Grafana-tracing", "Honeycomb-Logs")
- Destination Type - Choose between "Traces" or "Logs"
- OTLP Endpoint - The URL where your observability platform accepts OTLP data.
- Custom Headers (Optional) - Any authentication headers or other provider-required headers
- Save your destination
After setting up destinations in the dashboard, configure your Worker to export telemetry data by updating your Wrangler configuration. Your destination name configured in your configuration file should be the same as the destination configured in the dashboard.
{
	"observability": {
		"traces": {
			"enabled": true,
			"destinations": ["tracing-destination-name"],

			// traces sample rate of 5%
			"head_sampling_rate": 0.05,

			// (optional) set to false to only export traces to your
			// destination without persisting them in the Cloudflare dashboard
			"persist": false
		},
		"logs": {
			"enabled": true,
			"destinations": ["logs-destination-name"],
			// logs sample rate of 60%
			"head_sampling_rate": 0.6,

			// (optional) set to false to only export logs to your
			// destination without persisting them in the Cloudflare dashboard
			"persist": false
		}
	}
}[observability.traces]
enabled = true
destinations = [ "tracing-destination-name" ]
head_sampling_rate = 0.05
persist = false
[observability.logs]
enabled = true
destinations = [ "logs-destination-name" ]
head_sampling_rate = 0.6
persist = falseOnce you've configured your Wrangler configuration file, redeploy your Worker for new configurations to take effect. Note that it may take a few minutes for events to reach your destination.
After creating a destination, you can monitor its health and delivery status in the Cloudflare dashboard. Each destination displays a status indicator that shows how recently data was successfully delivered.
| Status | Description | Troubleshooting |
|---|---|---|
| Last: n minutes ago | Data was recently delivered successfully. | |
| Never run | No data has been delivered to this destination. | •Check if your Worker is receiving traffic • Review sampling rates (low rates generate less data) |
| Error | An error occurred while attempting to deliver data to this destination. | • Verify OTLP endpoint URL is correct • Check authentication headers are valid |
Exporting OTel data is currently free to those currently on a Workers Paid subscription or higher during the early beta period. However, starting on March 1, 2026, tracing will be billed as part of your usage on the Workers Paid plan or contract.
This includes the following limits and pricing:
| Plan | Traces | Logs | Pricing |
|---|---|---|---|
| Workers Free | Not available | Not available | - |
| Workers Paid | 10 million events per month included | 10 million events per month included | $0.05 per million additional events |
OpenTelemetry data export is currently in beta. Please be aware of the following limitations:
- Metrics export not yet supported: Exporting Worker infrastructure metrics and custom metrics via OpenTelemetry is not currently available. We are actively working to add metrics support in the future.
- Limited OTLP support from some providers: Some observability providers are still rolling out OTLP endpoint support. Check the Available OpenTelemetry destinations table above for current availability.