
Audit Logs v2 is now generally available to all Cloudflare customers.
Audit Logs v2 provides a unified and standardized system for tracking and recording all user and system actions across Cloudflare products. Built on Cloudflare's API Shield / OpenAPI gateway, logs are generated automatically without requiring manual instrumentation from individual product teams, ensuring consistency across ~95% of Cloudflare products.
What's available at GA:
Standardized logging — Audit logs follow a consistent format across all Cloudflare products, making it easier to search, filter, and investigate activity.
Expanded product coverage — ~95% of Cloudflare products covered, up from ~75% in v1.
Granular filtering — Filter by actor, action type, action result, resource, raw HTTP method, zone, and more. Over 20 filter parameters available via the API.
Enhanced context — Each log entry includes authentication method, interface (API or dashboard), Cloudflare Ray ID, and actor token details.
18-month retention — Logs are retained for 18 months. Full history is accessible via the API or Logpush.
Access:
Dashboard: Go to Manage Account > Audit Logs. Audit Logs v2 is shown by default.
API: GET https://api.cloudflare.com/client/v4/accounts/{account_id}/logs/audit
Logpush: Available via the audit_logs_v2 account-scoped dataset.
Important notes:
Approximately 30 days of logs from the Beta period (back to ~February 8, 2026) are available at GA. These Beta logs will expire on ~April 9, 2026. Logs generated after GA will be retained for the full 18 months. Older logs remain available in Audit Logs v1.
The UI query window is limited to 90 days for performance reasons. Use the API or Logpush for access to the full 18-month history.
GET requests (view actions) and 4xx error responses are not logged at GA. GET logging will be selectively re-enabled for sensitive read operations in a future release.
Audit Logs v1 continues to run in parallel. A deprecation timeline will be communicated separately.
Before and after values — the ability to see what a value changed from and to — is a highly requested feature and is on our roadmap for a post-GA release. In the meantime, we recommend using Audit Logs v1 for before and after values. Audit Logs v1 will continue to run in parallel until this feature is available in v2.
Edit: this post has been edited to clarify crawling behavior with respect to site guidance.
You can now crawl an entire website with a single API call using Browser Rendering's new /crawl endpoint, available in open beta. Submit a starting URL, and pages are automatically discovered, rendered in a headless browser, and returned in multiple formats, including HTML, Markdown, and structured JSON. The endpoint is a verified bot (intermediary agent) that respects robots.txt and AI Crawl Control ↗ by default, making it easy for developers to comply with website rules, and making it less likely for crawlers to ignore web-owner guidance. This is great for training models, building RAG pipelines, and researching or monitoring content across a site.
Crawl jobs run asynchronously. You submit a URL, receive a job ID, and check back for results as pages are processed.
Multiple output formats - Return crawled content as HTML, Markdown, and structured JSON (powered by Workers AI)
Crawl scope controls - Configure crawl depth, page limits, and wildcard patterns to include or exclude specific URL paths
Automatic page discovery - Discovers URLs from sitemaps, page links, or both
Incremental crawling - Use modifiedSince and maxAge to skip pages that haven't changed or were recently fetched, saving time and cost on repeated crawls
Static mode - Set render: false to fetch static HTML without spinning up a browser, for faster crawling of static sites
Well-behaved bot - Honors robots.txt directives, including crawl-delay
Available on both the Workers Free and Paid plans.
Note: the /crawl endpoint cannot bypass Cloudflare bot detection or captchas, and self-identifies as a bot.
The initial release focuses on detecting Broken Object Level Authorization (BOLA) vulnerabilities by building API call graphs to simulate attacker and owner contexts, then testing these contexts by sending real HTTP requests to your APIs.
The scanner is now available via the Cloudflare API. To scan, set up your target environment, owner and attacker credentials, and upload your OpenAPI file with response schemas. The scanner will be available in the Cloudflare dashboard in a future release.
Access: This feature is only available to API Shield subscribers via the Cloudflare API. We hope you will use the API for programmatic integration into your CI/CD pipelines and security dashboards.
Cloudflare Workflows allows you to configure specific retry logic for each step in your workflow execution. Now, you can access which retry attempt is currently executing for calls to step.do():
await step.do("my-step", async (ctx) => { // ctx.attempt is 1 on first try, 2 on first retry, etc. console.log(`Attempt ${ctx.attempt}`);});
You can use the step context for improved logging & observability, progressive backoff, or conditional logic in your workflow definition.
Note that the current attempt number is 1-indexed. For more information on retry behavior, refer to Sleeping and Retrying.
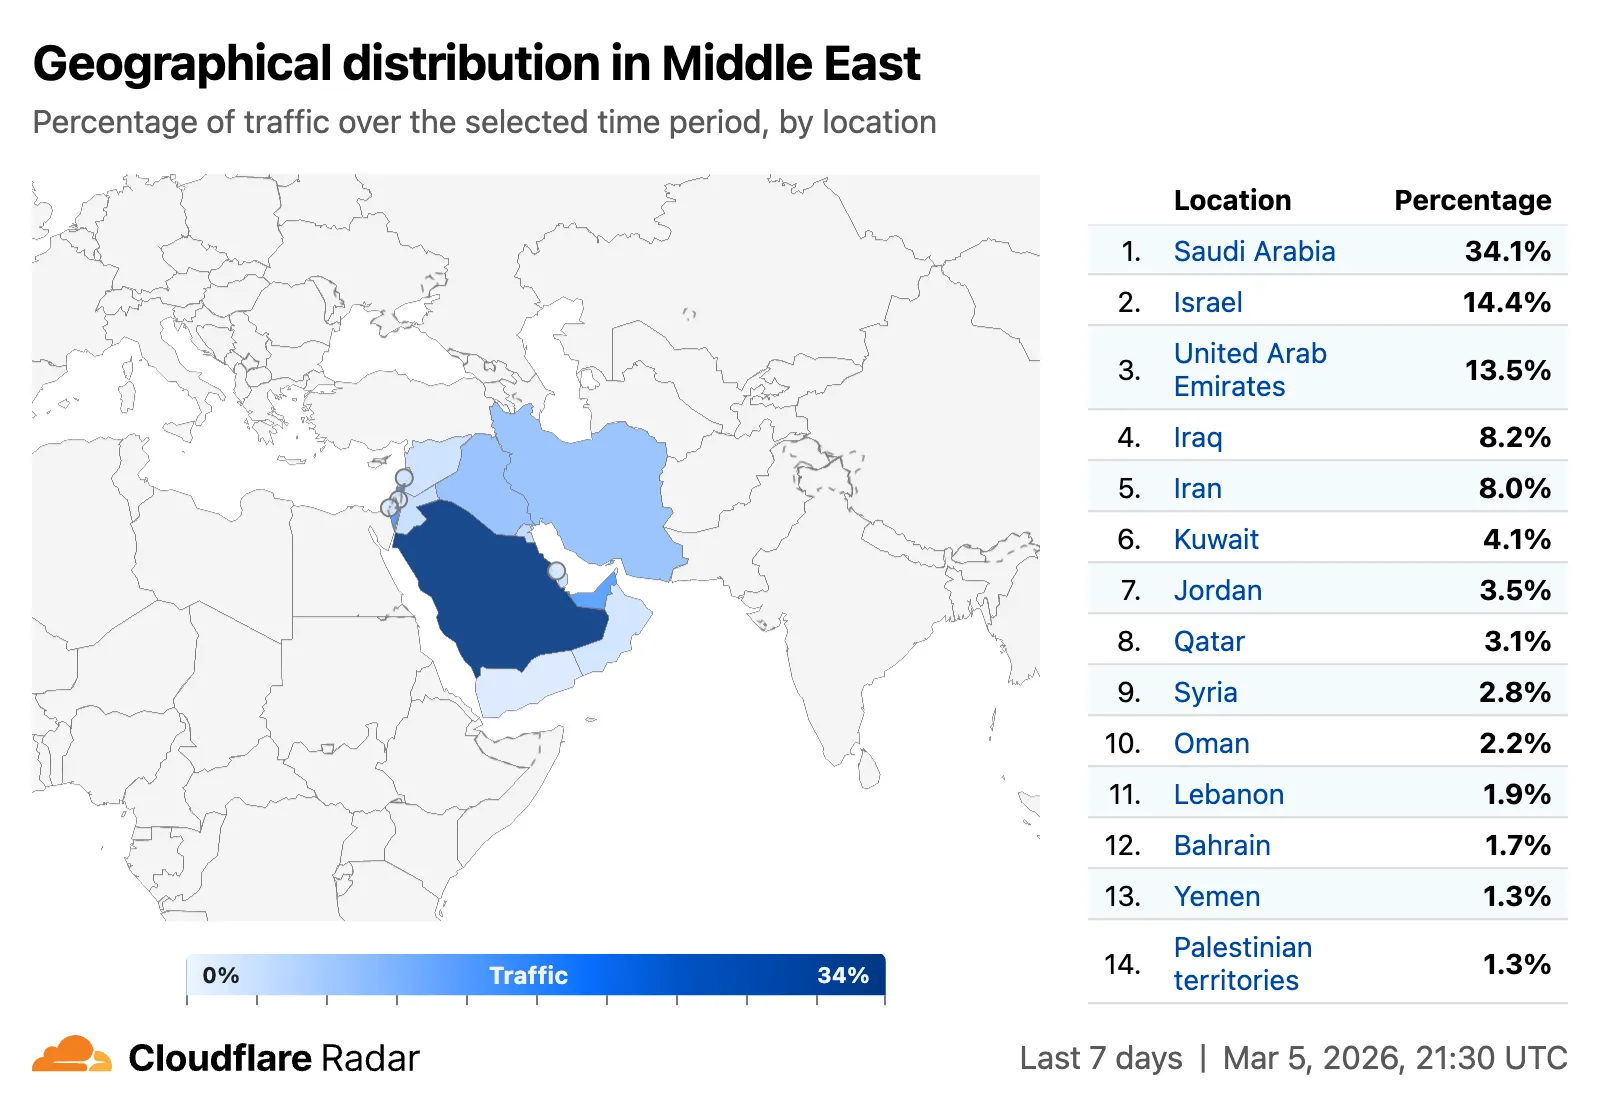
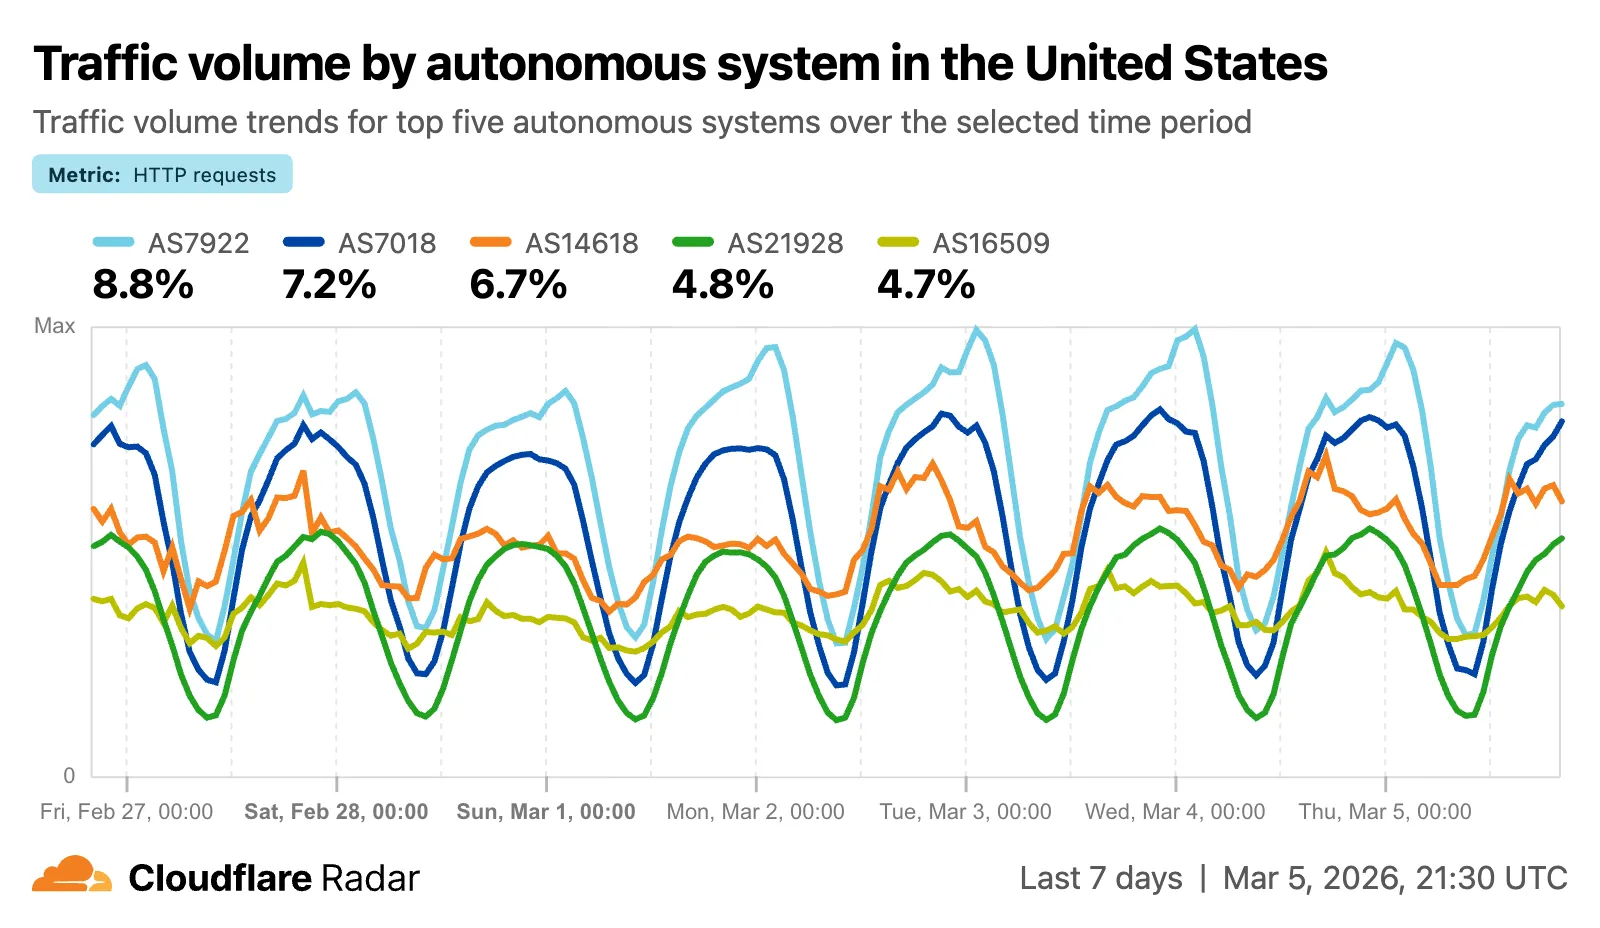
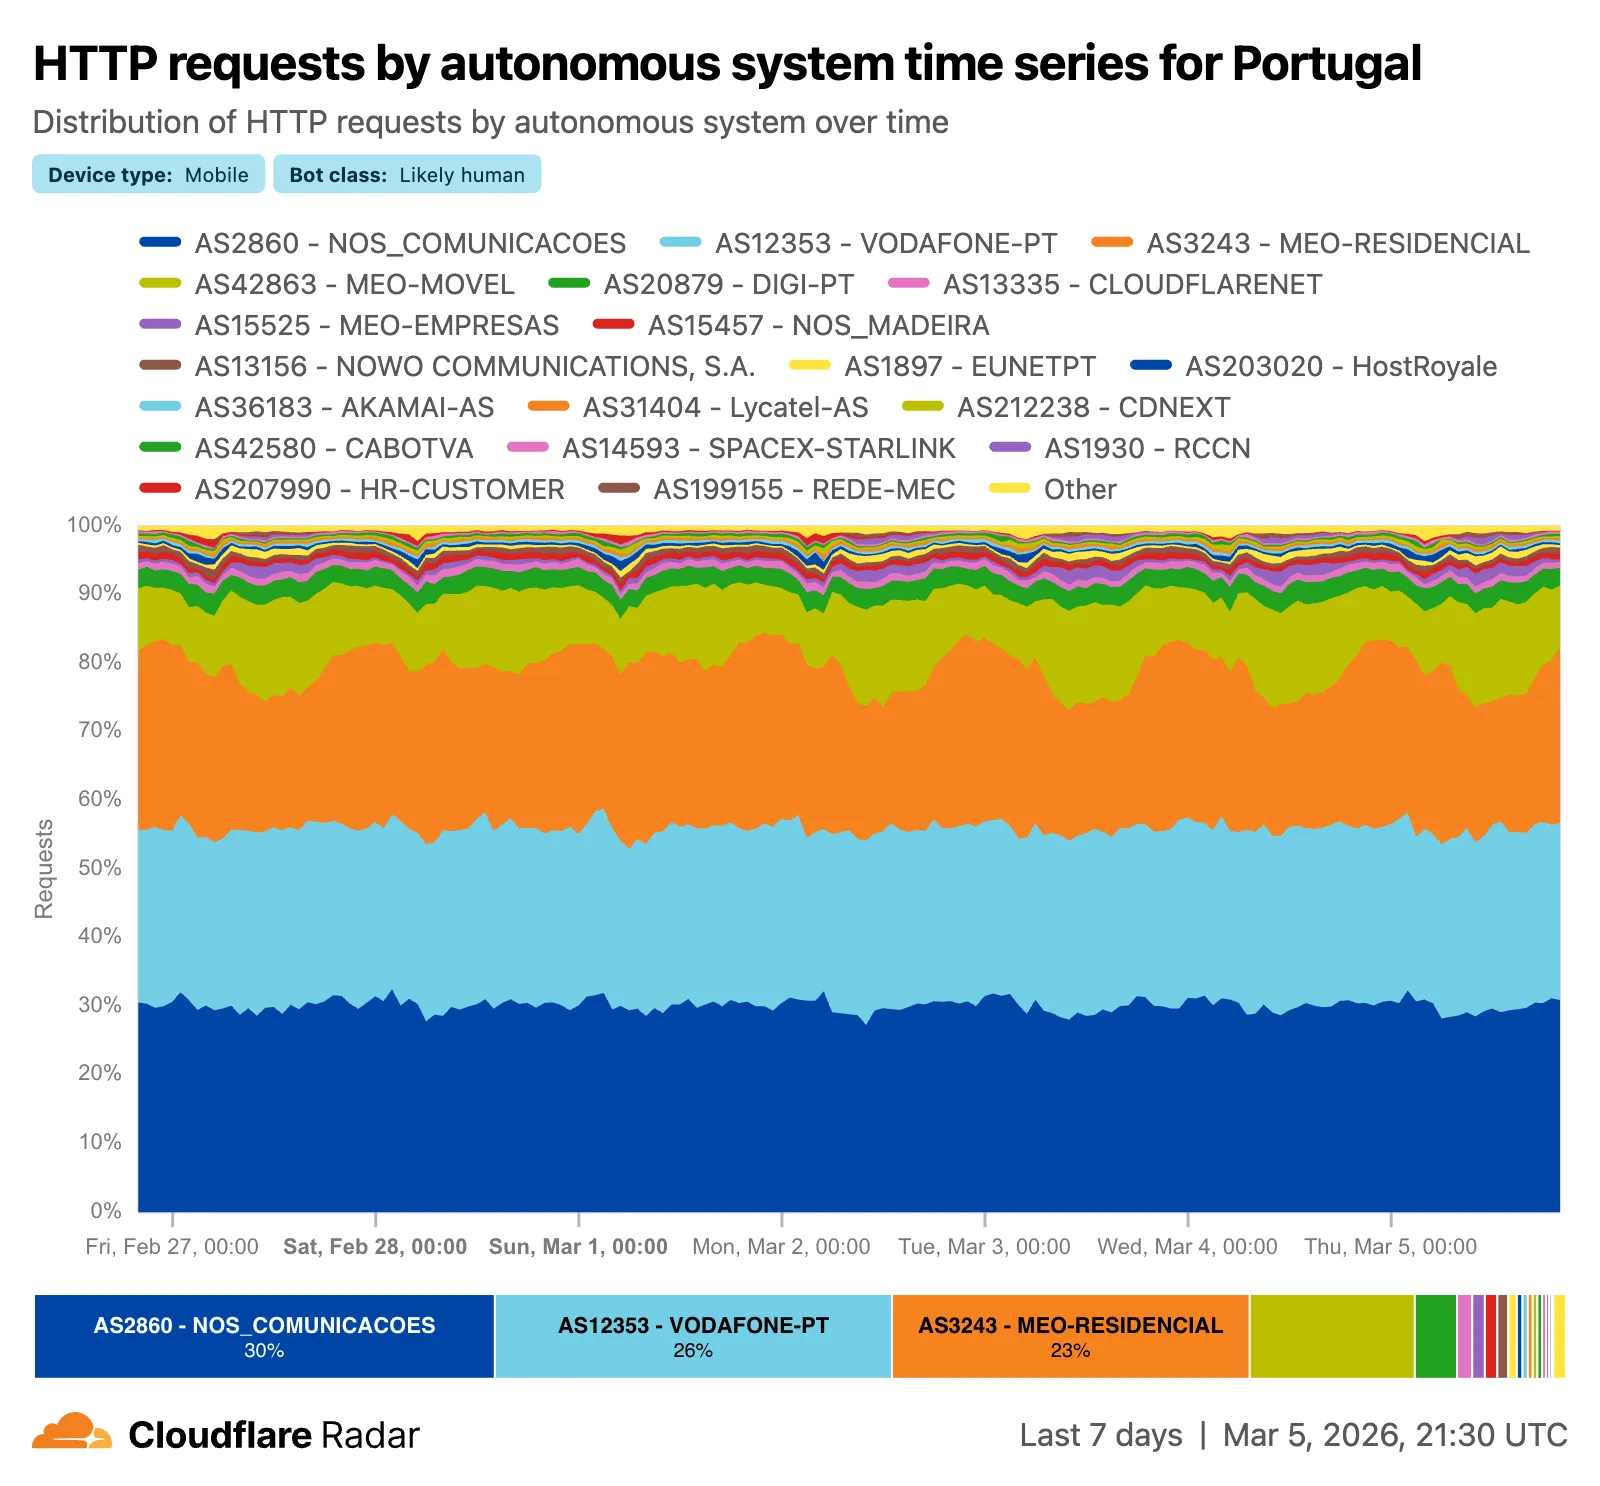
Radar ships several new features that improve the flexibility and usability of the platform, as well as visibility into what is happening on the Internet.
Traffic volume by top autonomous systems and locations
A new traffic volume view shows the top autonomous systems and countries/territories for a given location. This is useful for quickly determining which network providers in a location may be experiencing connectivity issues, or how traffic is distributed across a region.
The new AS and location dimensions have also been added to the Data Explorer ↗ for the HTTP, DNS, and NetFlows datasets. Combined with other available filters, this provides a powerful tool for generating unique insights.
Finally, breadcrumb navigation is now available on most pages, allowing easier navigation between parent and related pages.
During a meeting, participant audio is routed through AI Gateway to Nova-3 on Workers AI — so transcription runs on Cloudflare's network end-to-end, reducing latency compared to routing through external speech-to-text services.
Set the language when creating a meeting via ai_config.transcription.language:
Supported languages include English, Spanish, French, German, Hindi, Russian, Portuguese, Japanese, Italian, and Dutch — with regional variants like en-AU, en-GB, en-IN, en-NZ, es-419, fr-CA, de-CH, pt-BR, and pt-PT. Use multi for automatic multilingual detection.
If you are building voice agents or real-time translation workflows, your agent can now transcribe in the caller's language natively — no extra services or routing logic needed.
We have introduced new triage controls to help you manage your Brand Protection results more efficiently. You can now clear out the noise by dismissing matches while maintaining full visibility into your historical decisions.
What's new
Dismiss matches: Users can now mark specific results as dismissed if they are determined to be benign or false positives, removing them from the primary triage view.
Show/Hide toggle: A new visibility control allows you to instantly switch between viewing only active matches and including previously dismissed ones.
Persistent review states: Dismissed status is saved across sessions, ensuring that your workspace remains organized and focused on new or high-priority threats.
Key benefits of the dismiss match functionality:
Reduce alert fatigue by hiding known-safe results, allowing your team to focus exclusively on unreviewed or high-risk infringements.
Auditability and recovery through the visibility toggle, ensuring that no match is ever truly "lost" and can be re-evaluated if a site's content changes.
Improved collaboration as your team members can see which matches have already been vetted and dismissed by others.
Browser Rendering REST API rate limits for Workers Paid plans have been increased from 3 requests per second (180/min) to 10 requests per second (600/min). No action is needed to benefit from the higher limit.
The REST API lets you perform common browser tasks with a single API call, and you can now do it at a higher rate.
You can now use user risk scores in your Access policies. The new User Risk Score selector allows you to create Access policies that respond to user behavior patterns detected by Cloudflare's risk scoring system, including impossible travel, high DLP policy matches, and more.
Previously, proxy endpoints relied on static source IP addresses to authorize traffic, providing no user-level identity in logs or policies. The new authorization proxy replaces IP-based authorization with Cloudflare Access authentication, verifying who a user is before applying Gateway filtering without installing the WARP client.
This is ideal for environments where you cannot deploy a device client, such as virtual desktops (VDI), mergers and acquisitions, or compliance-restricted endpoints.
Key capabilities
Identity-aware proxy traffic — Users authenticate through your identity provider (Okta, Microsoft Entra ID, Google Workspace, and others) via Cloudflare Access. Logs now show exactly which user accessed which site, and you can write identity-based policies like "only the Finance team can access this accounting tool."
Multiple identity providers — Display one or multiple login methods simultaneously, giving flexibility for organizations managing users across different identity systems.
Cloudflare-hosted PAC files — Create and host PAC files directly in Cloudflare One with pre-configured templates for Okta and Azure, hosted at https://pac.cloudflare-gateway.com/<account-id>/<slug> on Cloudflare's global network.
Simplified billing — Each user occupies a seat, exactly like they do with the Cloudflare One Client. No new metrics to track.
Get started
In Cloudflare One ↗, go to Networks > Resolvers & Proxies > Proxy endpoints.
Previously, each instance was limited to 1,024 steps. Now, Workflows can support more complex, long-running executions without the additional complexity of recursive or child workflow calls.
Note that the maximum persisted state limit per Workflow instance remains 100 MB for Workers Free and 1 GB for Workers Paid. Refer to Workflows limits for more information.
Sandboxes now support real-time filesystem watching via sandbox.watch(). The method returns a Server-Sent Events ↗ stream backed by native inotify, so your Worker receives create, modify, delete, and move events as they happen inside the container.
sandbox.watch(path, options)
Pass a directory path and optional filters. The returned stream is a standard ReadableStream you can proxy directly to a browser client or consume server-side.
// Stream events to a browser clientconst stream = await sandbox.watch("/workspace/src", { recursive: true, include: ["*.ts", "*.js"],});return new Response(stream, { headers: { "Content-Type": "text/event-stream" },});
// Stream events to a browser clientconst stream = await sandbox.watch("/workspace/src", { recursive: true, include: ["*.ts", "*.js"],});return new Response(stream, { headers: { "Content-Type": "text/event-stream" },});
Server-side consumption with parseSSEStream
Use parseSSEStream to iterate over events inside a Worker without forwarding them to a client.
import { parseSSEStream } from "@cloudflare/sandbox";import type { FileWatchSSEEvent } from "@cloudflare/sandbox";const stream = await sandbox.watch("/workspace/src", { recursive: true });for await (const event of parseSSEStream<FileWatchSSEEvent>(stream)) { console.log(event.type, event.path);}
Each event includes a type field (create, modify, delete, or move) and the affected path. Move events also include a from field with the original path.
Options
Option
Type
Description
recursive
boolean
Watch subdirectories. Defaults to false.
include
string[]
Glob patterns to filter events. Omit to receive all events.
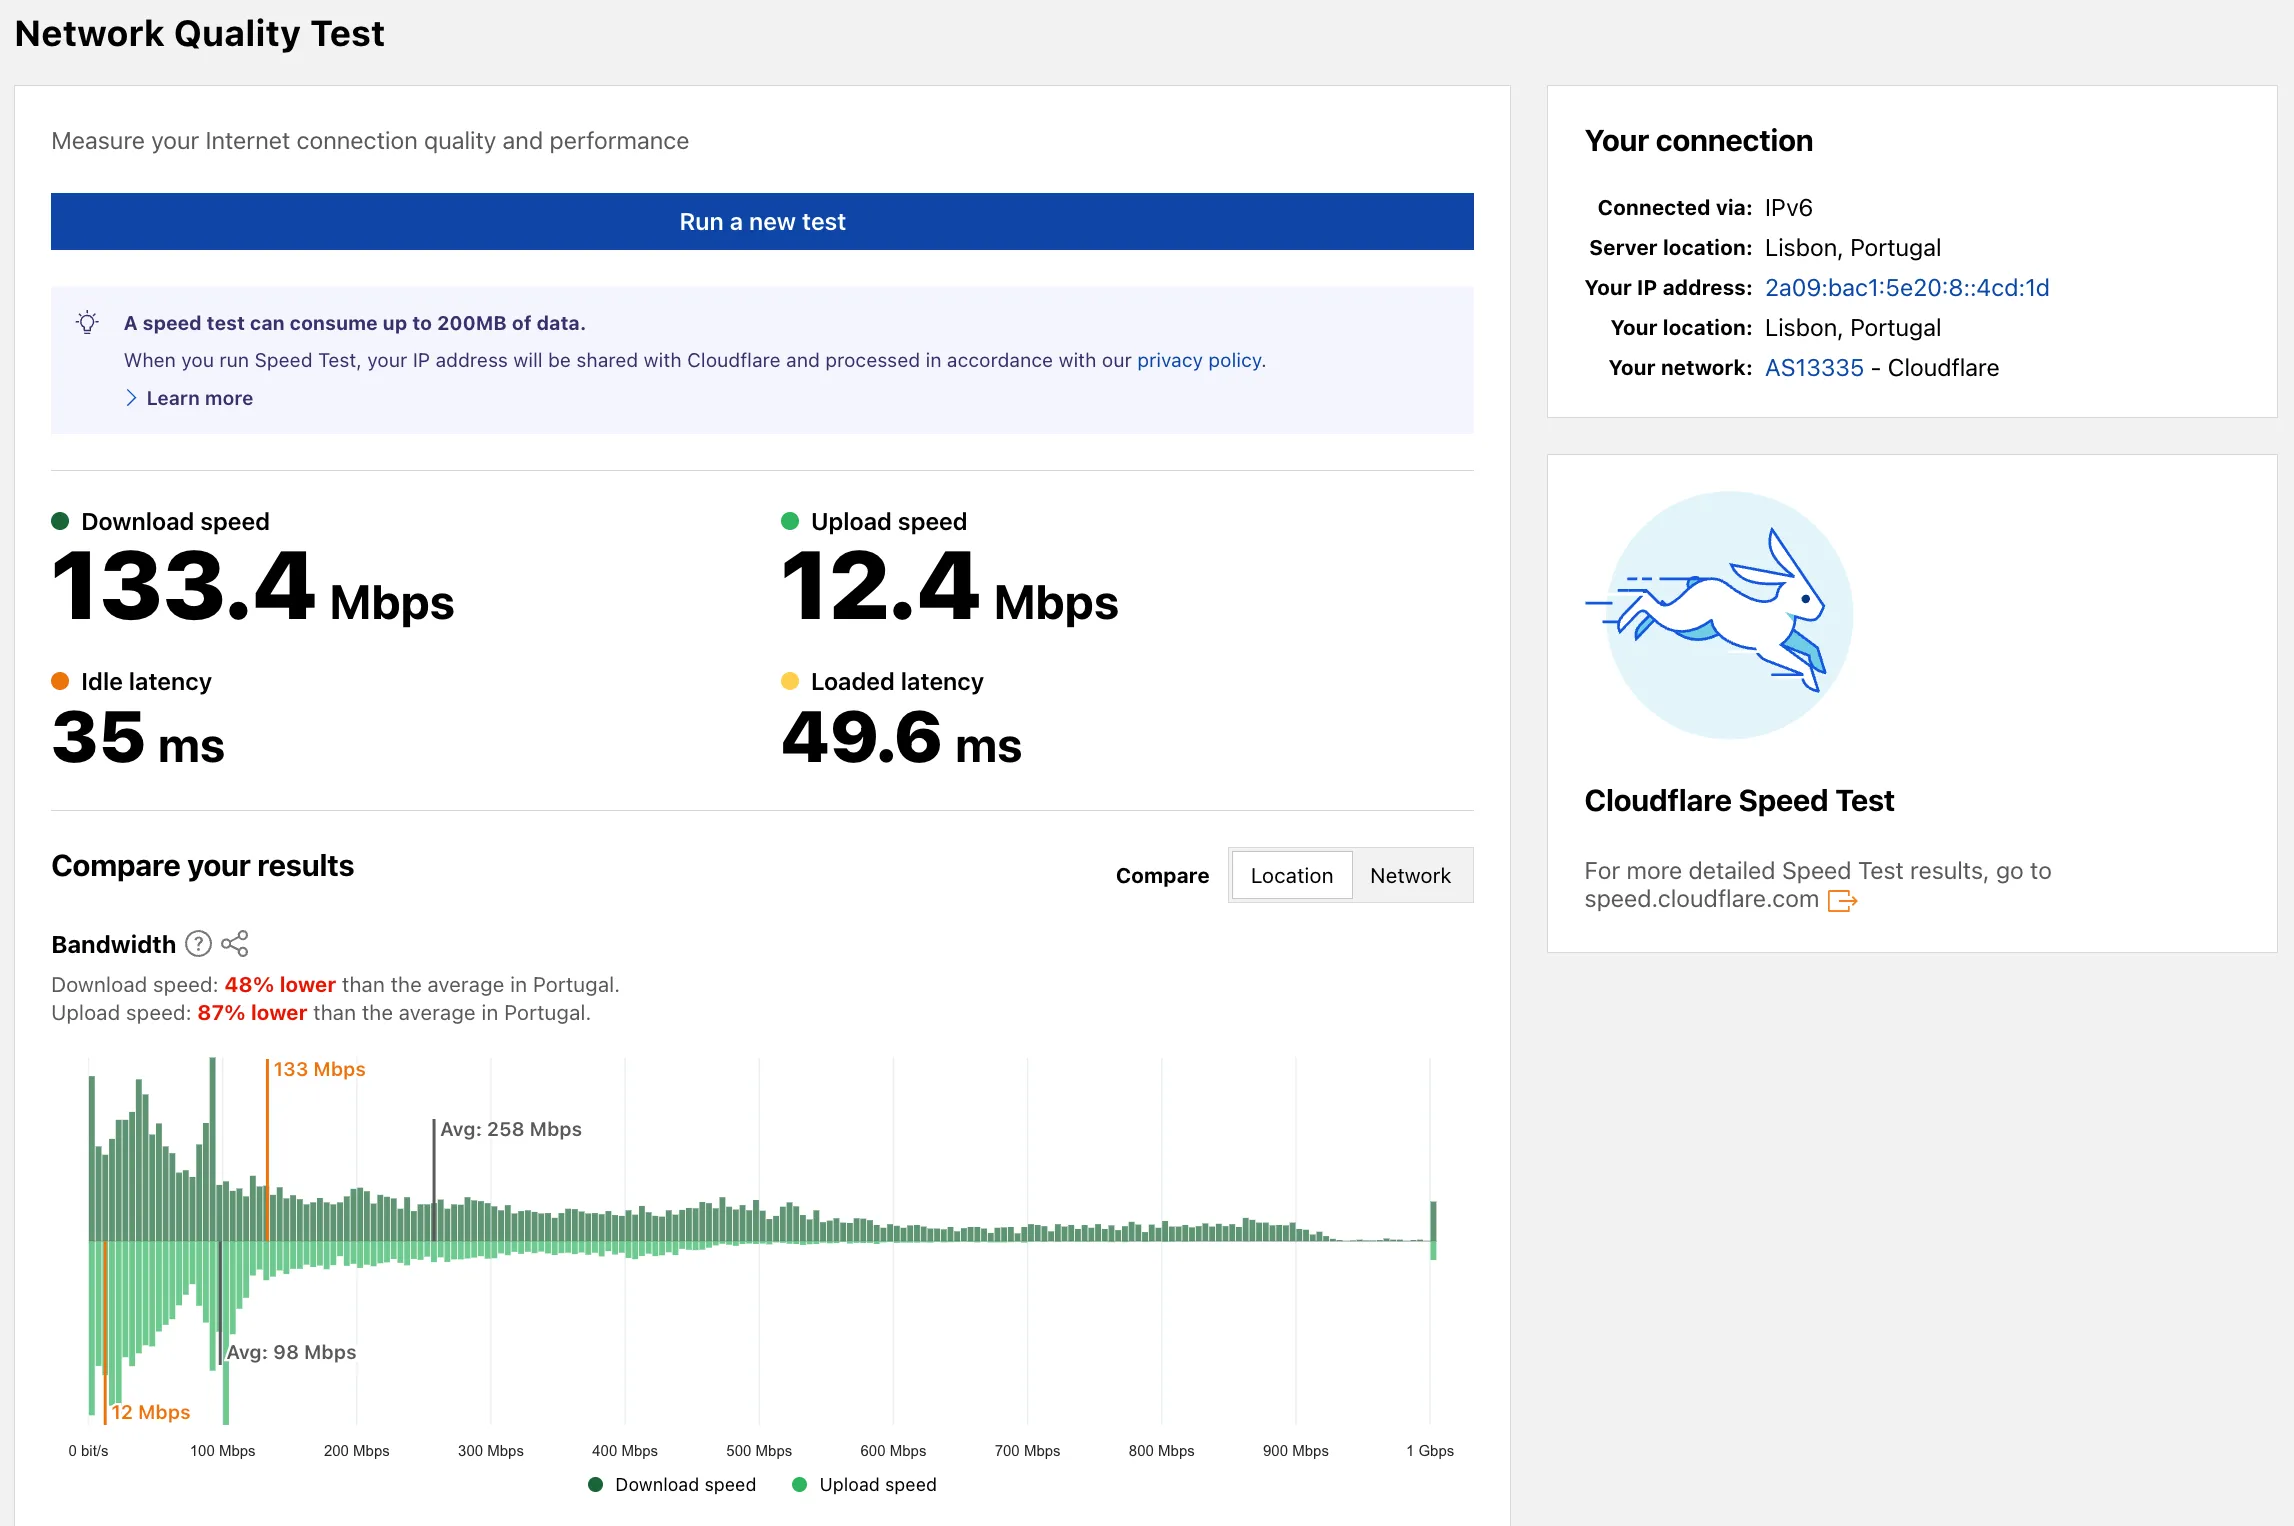
Radar now includes a Network Quality Test ↗ page. The tool measures Internet connection quality and performance, showing connection details such as IP address, server location, network (ASN), and IP version. For more detailed speed test results, the page links to speed.cloudflare.com ↗.
The latest release of the Agents SDK ↗ rewrites observability from scratch with diagnostics_channel, adds keepAlive() to prevent Durable Object eviction during long-running work, and introduces waitForMcpConnections so MCP tools are always available when onChatMessage runs.
Observability rewrite
The previous observability system used console.log() with a custom Observability.emit() interface. v0.7.0 replaces it with structured events published to diagnostics channels — silent by default, zero overhead when nobody is listening.
Every event has a type, payload, and timestamp. Events are routed to seven named channels:
Use the typed subscribe() helper from agents/observability for type-safe access:
import { subscribe } from "agents/observability";const unsub = subscribe("rpc", (event) => { if (event.type === "rpc") { console.log(`RPC call: ${event.payload.method}`); } if (event.type === "rpc:error") { console.error( `RPC failed: ${event.payload.method} — ${event.payload.error}`, ); }});// Clean up when doneunsub();
import { subscribe } from "agents/observability";const unsub = subscribe("rpc", (event) => { if (event.type === "rpc") { console.log(`RPC call: ${event.payload.method}`); } if (event.type === "rpc:error") { console.error( `RPC failed: ${event.payload.method} — ${event.payload.error}`, ); }});// Clean up when doneunsub();
In production, all diagnostics channel messages are automatically forwarded to Tail Workers — no subscription code needed in the agent itself:
export default { async tail(events) { for (const event of events) { for (const msg of event.diagnosticsChannelEvents) { // msg.channel is "agents:rpc", "agents:workflow", etc. console.log(msg.timestamp, msg.channel, msg.message); } } },};
export default { async tail(events) { for (const event of events) { for (const msg of event.diagnosticsChannelEvents) { // msg.channel is "agents:rpc", "agents:workflow", etc. console.log(msg.timestamp, msg.channel, msg.message); } } },};
The custom Observability override interface is still supported for users who need to filter or forward events to external services.
Durable Objects are evicted after a period of inactivity (typically 70-140 seconds with no incoming requests, WebSocket messages, or alarms). During long-running operations — streaming LLM responses, waiting on external APIs, running multi-step computations — the agent can be evicted mid-flight.
keepAlive() prevents this by creating a 30-second heartbeat schedule. The alarm firing resets the inactivity timer. Returns a disposer function that cancels the heartbeat when called.
AIChatAgent now waits for MCP server connections to settle before calling onChatMessage. This ensures this.mcp.getAITools() returns the full set of tools, especially after Durable Object hibernation when connections are being restored in the background.
For lower-level control, call this.mcp.waitForConnections() directly inside onChatMessage instead.
Other improvements
MCP deduplication by name and URL — addMcpServer with HTTP transport now deduplicates on both server name and URL. Calling it with the same name but a different URL creates a new connection. URLs are normalized before comparison (trailing slashes, default ports, hostname case).
callbackHost optional for non-OAuth servers — addMcpServer no longer requires callbackHost when connecting to MCP servers that do not use OAuth.
MCP URL security — Server URLs are validated before connection to prevent SSRF. Private IP ranges, loopback addresses, link-local addresses, and cloud metadata endpoints are blocked.
Custom denial messages — addToolOutput now supports state: "output-error" with errorText for custom denial messages in human-in-the-loop tool approval flows.
requestId in chat options — onChatMessage options now include a requestId for logging and correlating events.
You can now start using AI Gateway with a single API call — no setup required. Use default as your gateway ID, and AI Gateway creates one for you automatically on the first request.
To try it out, create an API token with AI Gateway - Read, AI Gateway - Edit, and Workers AI - Read permissions, then run:
AI Gateway gives you logging, caching, rate limiting, and access to multiple AI providers through a single endpoint. For more information, refer to Get started.
You can now copy Cloudflare One resources as JSON or as a ready-to-use API POST request directly from the dashboard. This makes it simple to transition workflows into API calls, automation scripts, or infrastructure-as-code pipelines.
To use this feature, click the overflow menu (⋮) on any supported resource and select Copy as JSON or Copy as POST request. The copied output includes only the fields present on your resource, giving you a clean and minimal starting point for your own API calls.
Initially supported resources:
Access applications
Access policies
Gateway policies
Resolver policies
Service tokens
Identity providers
We will continue to add support for more resources throughout 2026.
This week's release introduces new detections for vulnerabilities in SmarterTools SmarterMail (CVE-2025-52691 and CVE-2026-23760), alongside improvements to an existing Command Injection (nslookup) detection to enhance coverage.
Key Findings
CVE-2025-52691: SmarterTools SmarterMail mail server is vulnerable to Arbitrary File Upload, allowing an unauthenticated attacker to upload files to any location on the mail server, potentially enabling remote code execution.
CVE-2026-23760: SmarterTools SmarterMail versions prior to build 9511 contain an authentication bypass vulnerability in the password reset API permitting unaunthenticated to reset system administrator accounts failing to verify existing password or reset token.
Impact
Successful exploitation of these SmarterMail vulnerabilities could lead to full system compromise or unauthorized administrative access to mail servers. Administrators are strongly encouraged to apply vendor patches without delay.
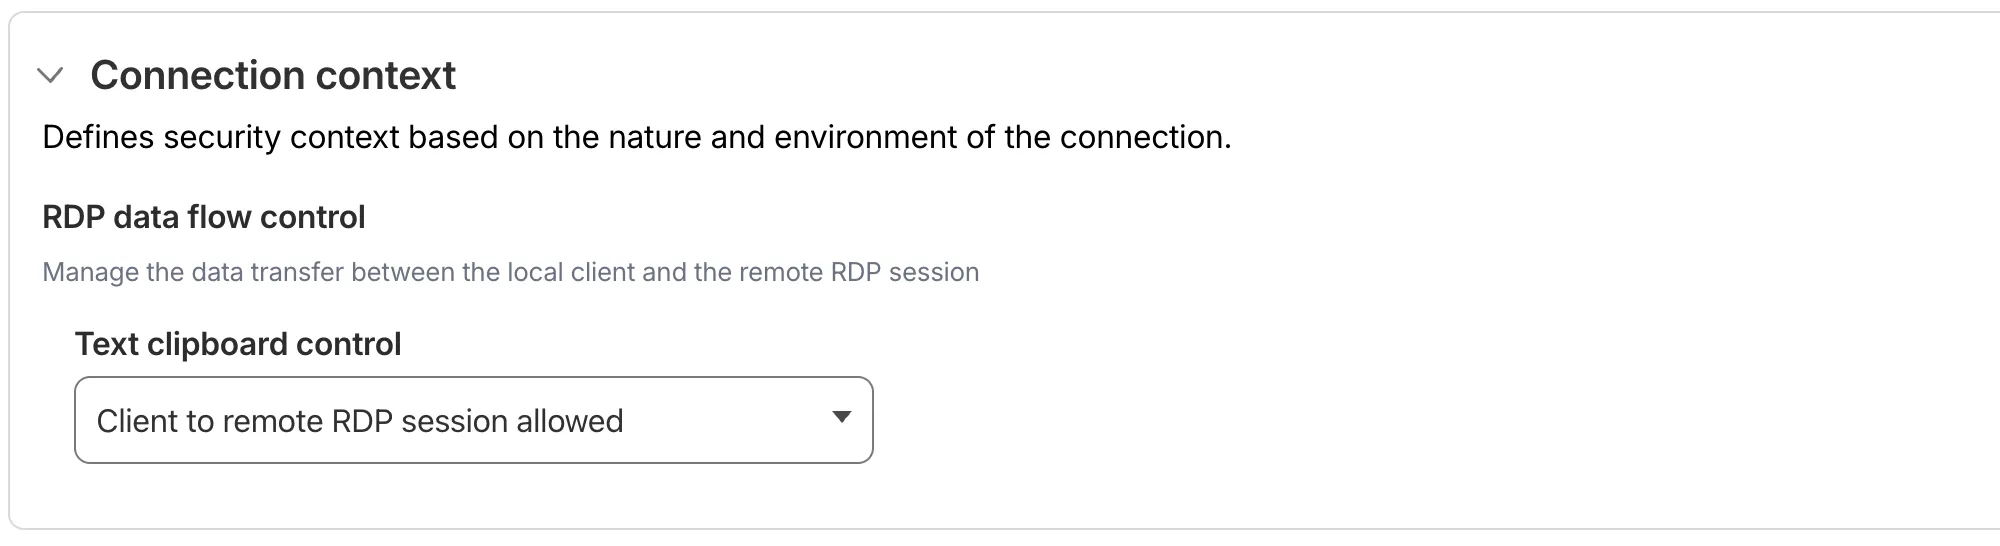
You can now configure clipboard controls for browser-based RDP with Cloudflare Access. Clipboard controls allow administrators to restrict whether users can copy or paste text between their local machine and the remote Windows server.
This feature is useful for organizations that support bring-your-own-device (BYOD) policies or third-party contractors using unmanaged devices. By restricting clipboard access, you can prevent sensitive data from being transferred out of the remote session to a user's personal device.
Configuration options
Clipboard controls are configured per policy within your Access application. For each policy, you can independently allow or deny:
Copy from local client to remote RDP session — Users can copy/paste text from their local machine into the browser-based RDP session.
Copy from remote RDP session to local client — Users can copy/paste text from the browser-based RDP session to their local machine.
By default, both directions are denied for new policies. For existing Access applications created before this feature was available, clipboard access remains enabled to preserve backwards compatibility.
When a user attempts a restricted clipboard action, the clipboard content is replaced with an error message informing them that the action is not allowed.
MCP server portals now supports Logpush integration. You can automatically export MCP server portal activity logs to third-party storage destinations or security information and event management (SIEM) tools for analysis and auditing.
Available log fields
The MCP server portal logs dataset includes fields such as:
Datetime — Timestamp of the request
PortalID / PortalAUD — Portal identifiers
ServerID / ServerURL — Upstream MCP server details
Method — JSON-RPC method (for example, tools/call, prompts/get, resources/read)
Gateway Protocol Detection now supports seven additional protocols in beta:
Protocol
Notes
IMAP
Internet Message Access Protocol — email retrieval
POP3
Post Office Protocol v3 — email retrieval
SMTP
Simple Mail Transfer Protocol — email sending
MYSQL
MySQL database wire protocol
RSYNC-DAEMON
rsync daemon protocol
LDAP
Lightweight Directory Access Protocol
NTP
Network Time Protocol
These protocols join the existing set of detected protocols (HTTP, HTTP2, SSH, TLS, DCERPC, MQTT, and TPKT) and can be used with the Detected Protocol selector in Network policies to identify and filter traffic based on the application-layer protocol, without relying on port-based identification.
If protocol detection is enabled on your account, these protocols will automatically be logged when detected in your Gateway network traffic.
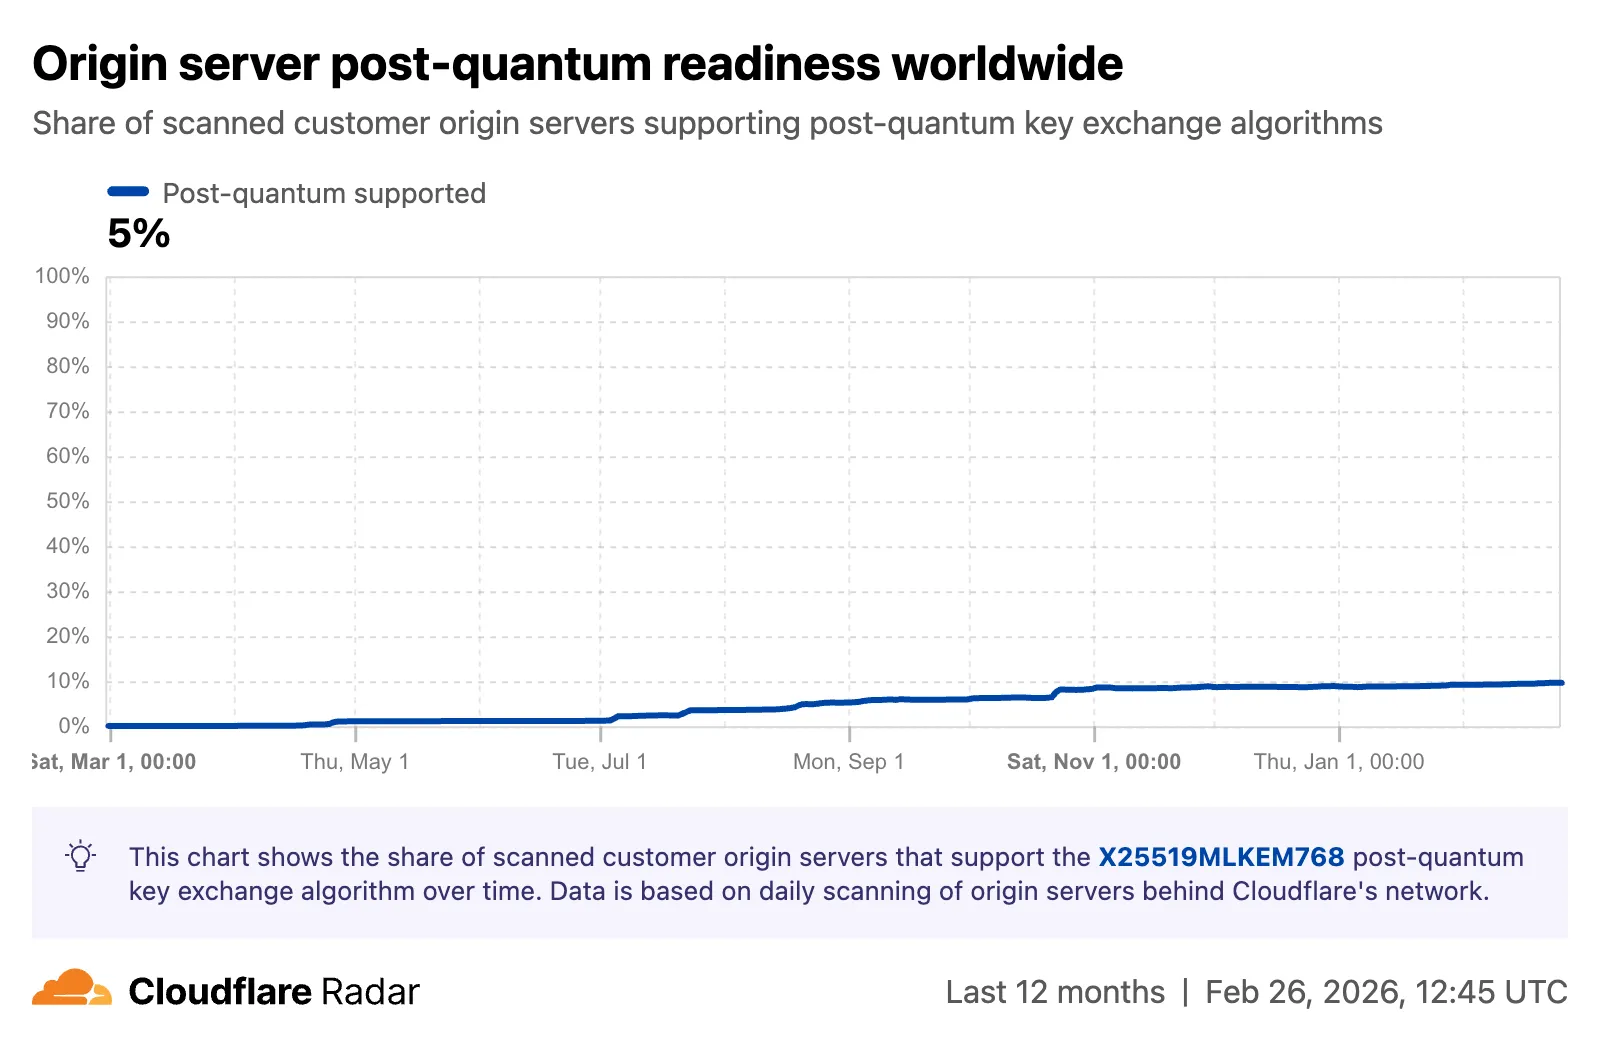
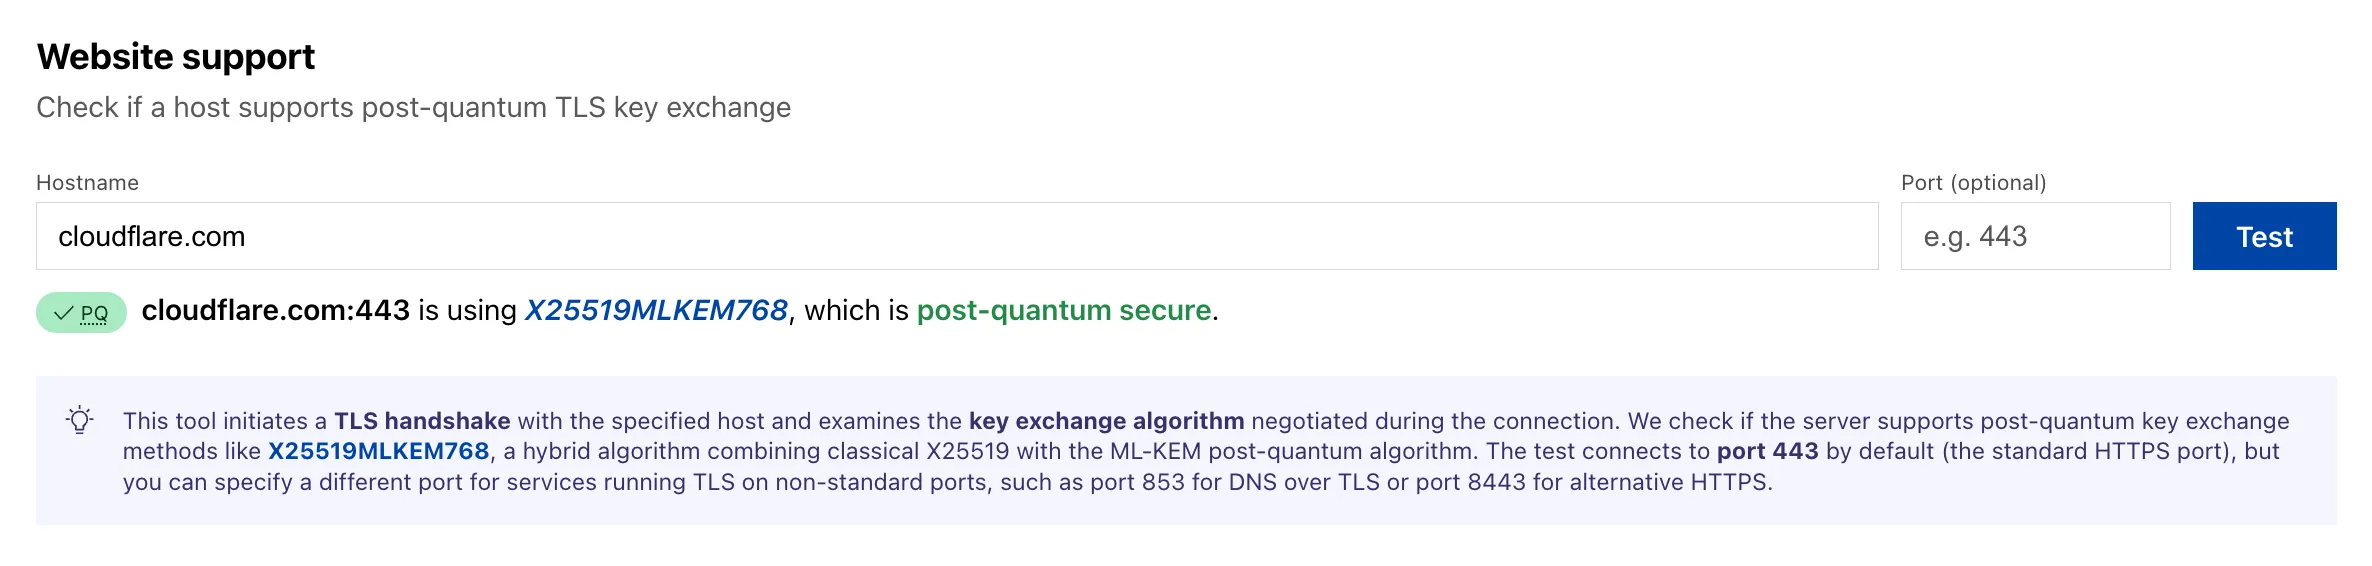
Radar now tracks post-quantum encryption support on origin servers, provides a tool to test any host for post-quantum compatibility, and introduces a Key Transparency dashboard for monitoring end-to-end encrypted messaging audit logs.
Post-quantum origin support
The new Post-Quantum API provides the following endpoints:
The new Post-Quantum Encryption ↗ page shows the share of customer origins supporting X25519MLKEM768, derived from daily automated TLS scans of TLS 1.3-compatible origins. The scanner tests for algorithm support rather than the origin server's configured preference.
A host test tool allows checking any publicly accessible website for post-quantum encryption compatibility. Enter a hostname and optional port to see whether the server negotiates a post-quantum key exchange algorithm.
Key Transparency
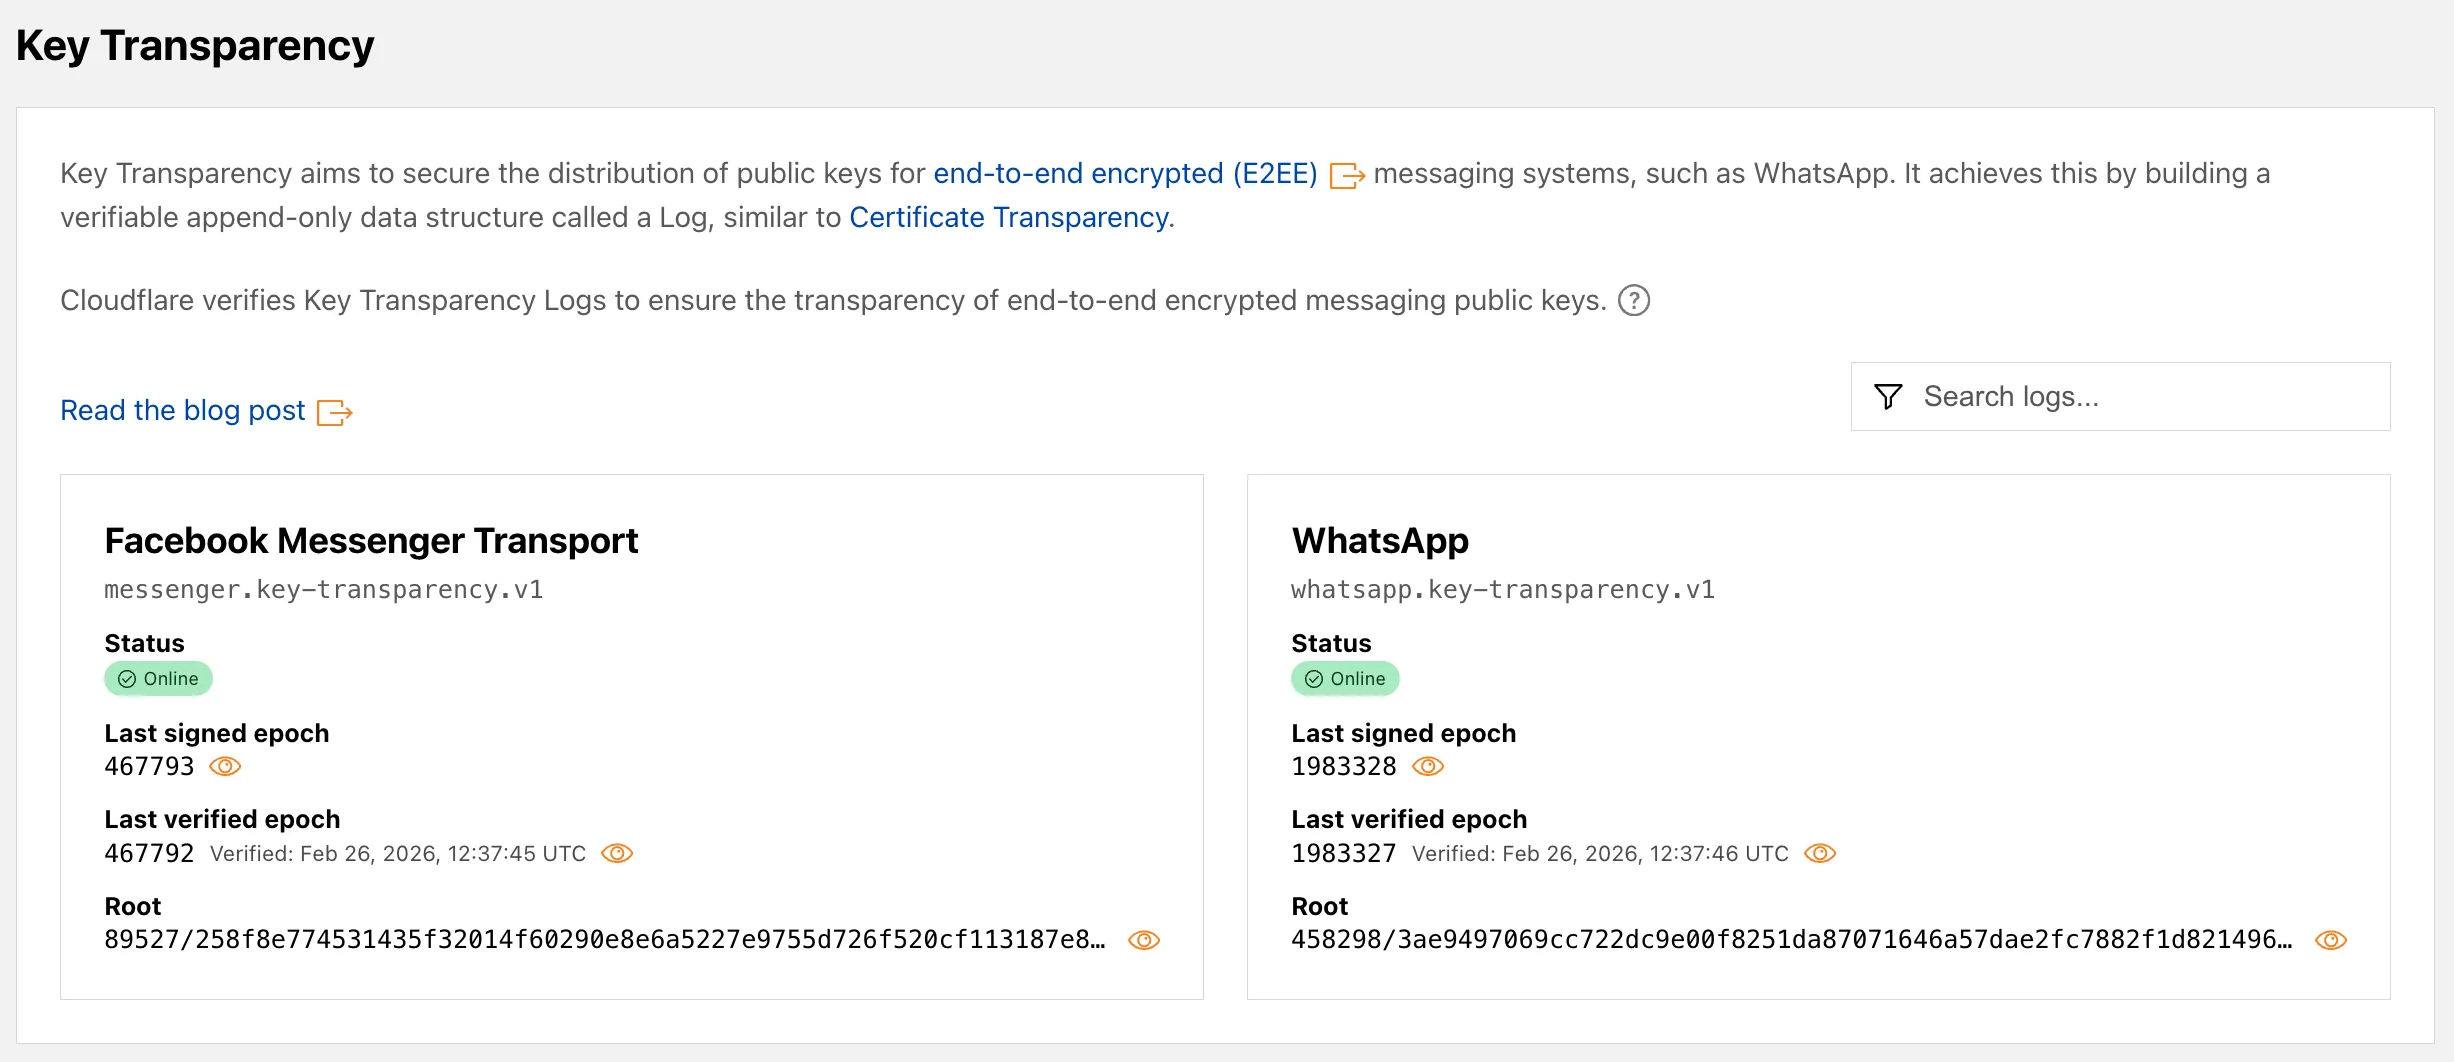
A new Key Transparency ↗ section displays the audit status of Key Transparency logs for end-to-end encrypted messaging services. The page launches with two monitored logs: WhatsApp and Facebook Messenger Transport.
Each log card shows the current status, last signed epoch, last verified epoch, and the root hash of the Auditable Key Directory tree. The data is also available through the Key Transparency Auditor API.
Cloudflare's stale-while-revalidate support is now fully asynchronous. Previously, the first request for a stale (expired) asset in cache had to wait for an origin response, after which that visitor received a REVALIDATED or EXPIRED status. Now, the first request after the asset expires triggers revalidation in the background and immediately receives stale content with an UPDATING status. All following requests also receive stale content with an UPDATING status until the origin responds, after which subsequent requests receive fresh content with a HIT status.
stale-while-revalidate is a Cache-Control directive set by your origin server that allows Cloudflare to serve an expired cached asset while a fresh copy is fetched from the origin.
Asynchronous revalidation brings:
Lower latency: No visitor is waiting for the origin when the asset is already in cache. Every request is served from cache during revalidation.
Consistent experience: All visitors receive the same cached response during revalidation.
Reduced error exposure: The first request is no longer vulnerable to origin timeouts or errors. All visitors receive a cached response while revalidation happens in the background.
Availability
This change is live for all Free, Pro, and Business zones. Approximately 75% of Enterprise zones have been migrated, with the remaining zones rolling out throughout the quarter.
Get started
To use this feature, make sure your origin includes the stale-while-revalidate directive in the Cache-Control header. Refer to the Cache-Control documentation for details.
Cloudflare now returns structured Markdown responses for Cloudflare-generated 1xxx errors when clients send Accept: text/markdown.
Each response includes YAML frontmatter plus guidance sections (What happened / What you should do) so agents can make deterministic retry and escalation decisions without parsing HTML.
In measured 1,015 comparisons, Markdown reduced payload size and token footprint by over 98% versus HTML.
When multiple values are present, Cloudflare selects the highest-priority supported media type using q values. If Markdown is not explicitly preferred, HTML is returned.
Availability
Available now for Cloudflare-generated 1xxx errors.