
Usage tracking
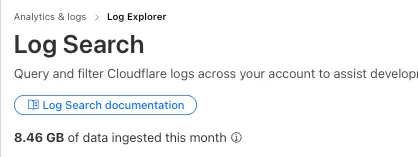
Log Explorer customers can now monitor their data ingestion volume to keep track of their billing. Monthly usage is displayed at the top of the Log Search and Manage Datasets screens in Log Explorer.

New updates and improvements at Cloudflare.
Log Explorer customers can now monitor their data ingestion volume to keep track of their billing. Monthly usage is displayed at the top of the Log Search and Manage Datasets screens in Log Explorer.
Radar now offers expanded insights into web crawlers, giving you greater visibility into aggregated trends in crawl and refer activity.
We have introduced the following endpoints:
/bots/crawlers/summary/{dimension}: Returns an overview of crawler HTTP request distributions across key dimensions./bots/crawlers/timeseries_groups/{dimension}: Provides time-series data on crawler request distributions across the same dimensions.These endpoints allow analysis across the following dimensions:
user_agent: Parsed data from the User-Agent header.referer: Parsed data from the Referer header.crawl_refer_ratio: Ratio of HTML page crawl requests to HTML page referrals by platform.In addition to crawler-specific insights, Radar now provides a broader set of bot endpoints:
/bots/: Lists all bots./bots/{bot_slug}: Returns detailed metadata for a specific bot./bots/timeseries: Time-series data for bot activity./bots/summary/{dimension}: Returns an overview of bot HTTP request distributions across key dimensions./bots/timeseries_groups/{dimension}: Provides time-series data on bot request distributions across the same dimensions.These endpoints support filtering and breakdowns by:
bot: Bot name.bot_operator: The organization or entity operating the bot.bot_category: Classification of bot type.The previously available verified_bots endpoints have now been deprecated in favor of this set of bot insights APIs.
While current data still focuses on verified bots, we plan to expand support for unverified bot traffic in the future.
Learn more about the new Radar bot and crawler insights in our blog post ↗.
Log Explorer is now GA, providing native observability and forensics for traffic flowing through Cloudflare.
Search and analyze your logs, natively in the Cloudflare dashboard. These logs are also stored in Cloudflare's network, eliminating many of the costs associated with other log providers.
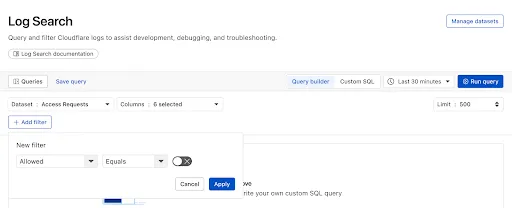
With Log Explorer, you can now:
For help getting started, refer to our documentation.
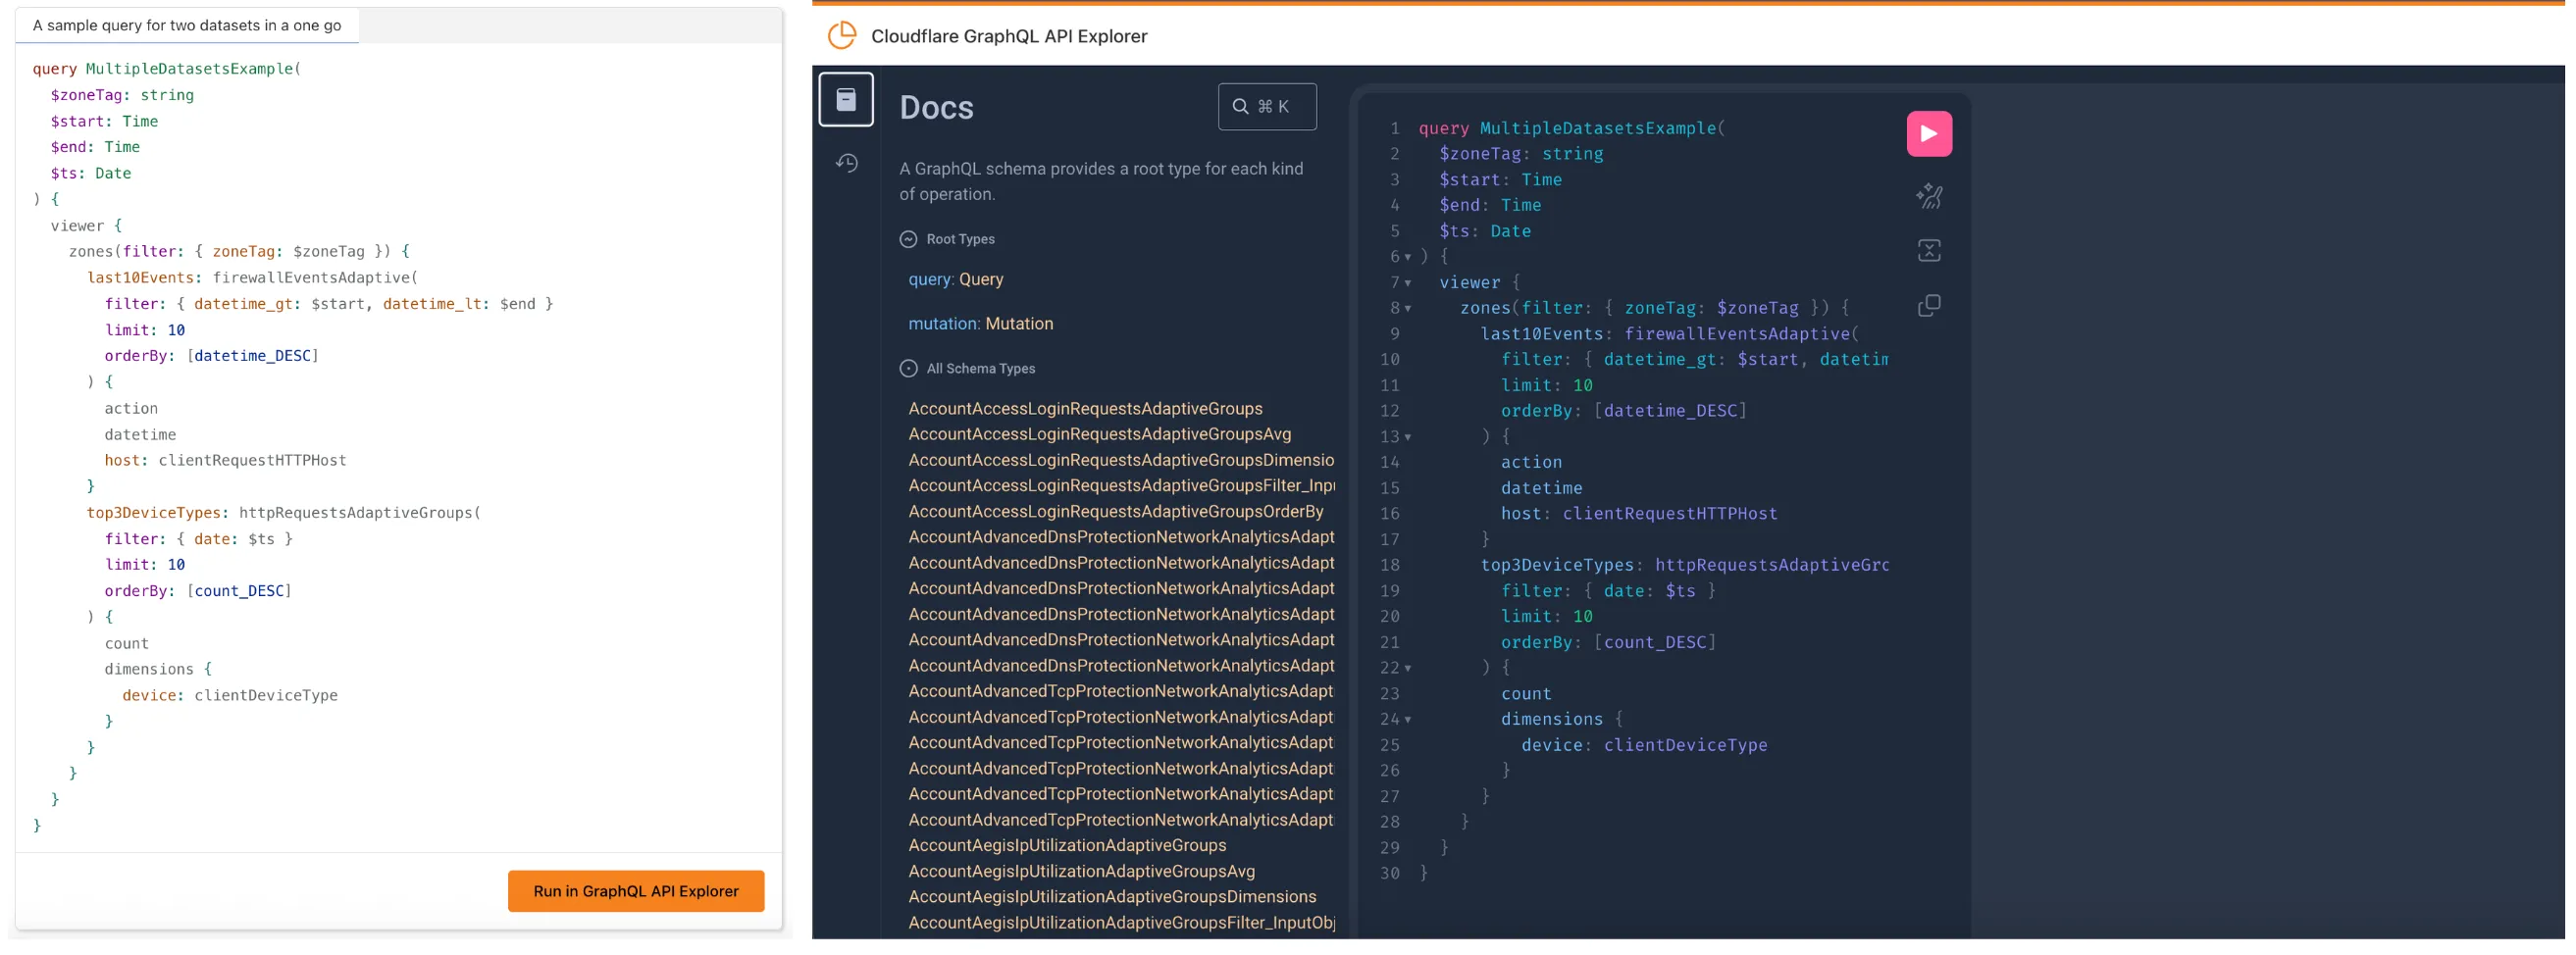
We’ve launched two powerful new tools to make the GraphQL Analytics API more accessible:
The new GraphQL API Explorer ↗ helps you build, test, and run queries directly in your browser. Features include:
MCP Servers let you use natural language tools like Claude to generate structured queries against your data. See our blog post ↗ for details on how they work and which servers are available. The new GraphQL MCP server ↗ helps you discover and generate useful queries for the GraphQL Analytics API. With this server, you can:
Example prompts include:
We’re continuing to expand these tools, and your feedback helps shape what’s next. Explore the documentation to learn more and get started.
Enterprise customers can now choose the geographic location from which a URL scan is performed — either via Security Center in the Cloudflare dashboard or via the URL Scanner API.
This feature gives security teams greater insight into how a website behaves across different regions, helping uncover targeted, location-specific threats.
What’s new:
Learn more in the Security Center documentation.
Custom Fields now support logging both raw and transformed values for request and response headers in the HTTP requests dataset.
These fields are configured per zone and apply to all Logpush jobs in that zone that include request headers, response headers. Each header can be logged in only one format—either raw or transformed—not both.
By default:
These defaults can be overridden to suit your logging needs.
For more information refer to Custom fields documentation
Radar has expanded its security insights, providing visibility into aggregate trends in authentication requests, including the detection of leaked credentials through leaked credentials detection scans.
We have now introduced the following endpoints:
/leaked_credential_checks/summary/{dimension}: Retrieves summaries of HTTP authentication requests distribution across two different dimensions./leaked_credential_checks/timeseries_groups/{dimension}: Retrieves timeseries data for HTTP authentication requests distribution across two different dimensions.The following dimensions are available, displaying the distribution of HTTP authentication requests based on:
compromised: Credential status (clean vs. compromised).bot_class: Bot class (human vs. bot).Dive deeper into leaked credential detection in this blog post ↗ and learn more about the expanded Radar security insights in our blog post ↗.
Digital Experience Monitoring (DEX) provides visibility into device, network, and application performance across your Cloudflare SASE deployment. The latest release of the Cloudflare One agent (v2025.1.861) now includes device endpoint monitoring capabilities to provide deeper visibility into end-user device performance which can be analyzed directly from the dashboard.
Device health metrics are now automatically collected, allowing administrators to:

This feature complements existing DEX features like synthetic application monitoring and network path visualization, creating a comprehensive troubleshooting workflow that connects application performance with device state.
For more details refer to our DEX documentation.
We’ve streamlined the Logpush setup process by integrating R2 bucket creation directly into the Logpush workflow!
Now, you no longer need to navigate multiple pages to manually create an R2 bucket or copy credentials. With this update, you can seamlessly configure a Logpush job to R2 in just one click, reducing friction and making setup faster and easier.
This enhancement makes it easier for customers to adopt Logpush and R2.
For more details refer to our Logs documentation.
Radar has expanded its DNS insights, providing visibility into aggregated traffic and usage trends observed by our 1.1.1.1 DNS resolver. In addition to global, location, and ASN traffic trends, we are also providing perspectives on protocol usage, query/response characteristics, and DNSSEC usage.
Previously limited to the top locations and ASes endpoints, we have now introduced the following endpoints:
/dns/timeseries: Retrieves DNS query volume over time./dns/summary/{dimension}: Retrieves summaries of DNS query distribution across ten different dimensions./dns/timeseries_groups/{dimension}: Retrieves timeseries data for DNS query distribution across ten different dimensions.For the summary and timeseries_groups endpoints, the following dimensions are available, displaying the distribution of DNS queries based on:
cache_hit: Cache status (hit vs. miss).dnsssec: DNSSEC support status (secure, insecure, invalid or other).dnsssec_aware: DNSSEC client awareness (aware vs. not-aware).dnsssec_e2e: End-to-end security (secure vs. insecure).ip_version: IP version (IPv4 vs. IPv6).matching_answer: Matching answer status (match vs. no-match).protocol: Transport protocol (UDP, TLS, HTTPS or TCP).query_type: Query type (A, AAAA, PTR, etc.).response_code: Response code (NOERROR, NXDOMAIN, REFUSED, etc.).response_ttl: Response TTL.Learn more about the new Radar DNS insights in our blog post ↗, and check out the new Radar page ↗.
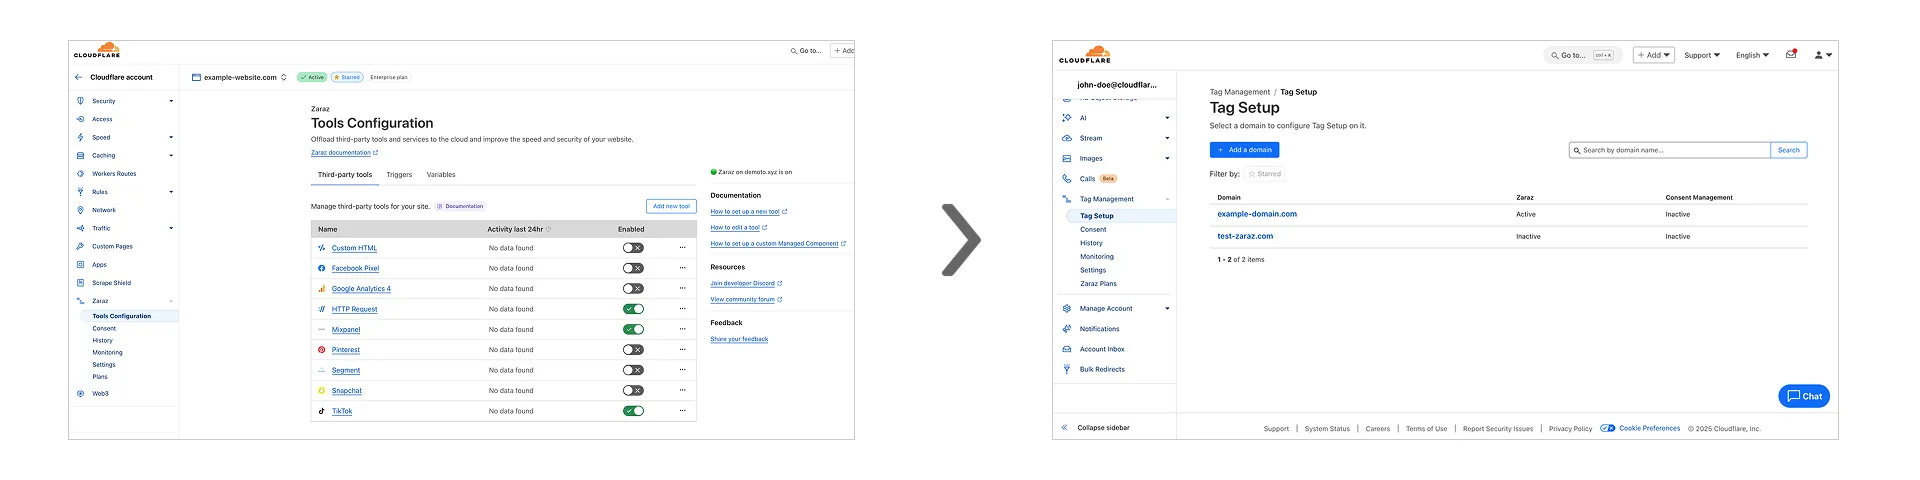
Previously, you could only configure Zaraz by going to each individual zone under your Cloudflare account. Now, if you’d like to get started with Zaraz or manage your existing configuration, you can navigate to the Tag Management ↗ section on the Cloudflare dashboard – this will make it easier to compare and configure the same settings across multiple zones.
These changes will not alter any existing configuration or entitlements for zones you already have Zaraz enabled on. If you’d like to edit existing configurations, you can go to the Tag Setup ↗ section of the dashboard, and select the zone you'd like to edit.
Radar has expanded its AI insights with new API endpoints for Internet services rankings, robots.txt analysis, and AI inference data.
Radar now provides rankings for Internet services, including Generative AI platforms, based on anonymized 1.1.1.1 resolver data. Previously limited to the annual Year in Review, these insights are now available daily via the API, through the following endpoints:
/ranking/internet_services/top show service popularity at a specific date./ranking/internet_services/timeseries_groups track ranking trends over time.Radar now analyzes robots.txt files from the top 10,000 domains, identifying AI bot access rules. AI-focused user agents from ai.robots.txt ↗ are categorized as:
*).These insights are now available weekly via the API, through the following endpoints:
/robots_txt/top/user_agents/directive to get the top AI user agents by directive./robots_txt/top/domain_categories to get the top domain categories by robots.txt files.Radar now provides insights into public AI inference models from Workers AI, tracking usage trends across models and tasks. These insights are now available via the API, through the following endpoints:
/ai/inference/summary/{dimension} to view aggregated model and task popularity./ai/inference/timeseries_groups/{dimension} to track changes over time for model or task.Learn more about the new Radar AI insights in our blog post ↗.
Cloudflare has introduced new fields to two Gateway-related datasets in Cloudflare Logs:
Gateway HTTP: ApplicationIDs, ApplicationNames, CategoryIDs, CategoryNames, DestinationIPContinentCode, DestinationIPCountryCode, ProxyEndpoint, SourceIPContinentCode, SourceIPCountryCode, VirtualNetworkID, and VirtualNetworkName.
Gateway Network: ApplicationIDs, ApplicationNames, DestinationIPContinentCode, DestinationIPCountryCode, ProxyEndpoint, SourceIPContinentCode, SourceIPCountryCode, TransportProtocol, VirtualNetworkID, and VirtualNetworkName.
The free version of Magic Network Monitoring (MNM) is now available to everyone with a Cloudflare account by default.
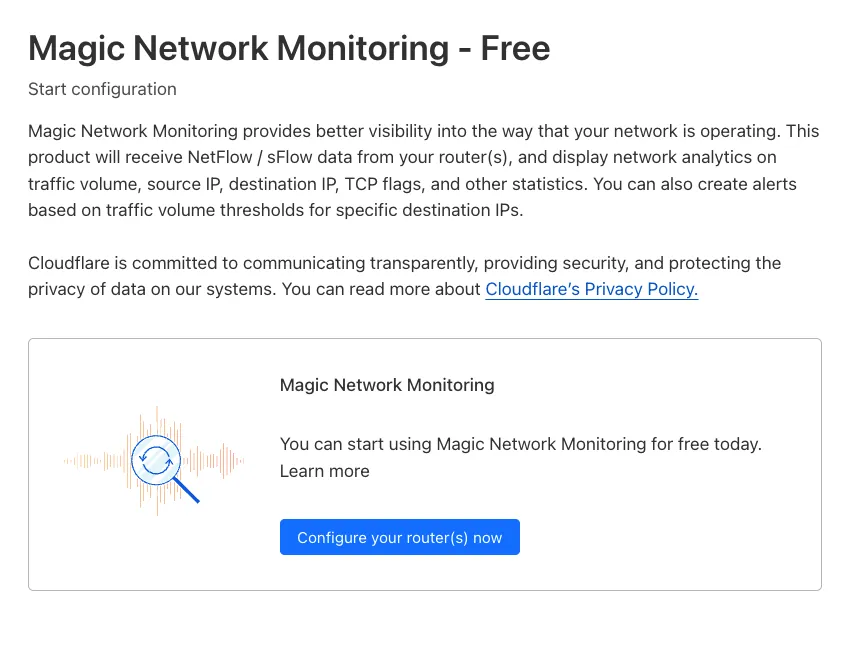
For more details, refer to the Get started guide.
Welcome to your new home for product updates on Cloudflare One.
Our new changelog lets you read about changes in much more depth, offering in-depth examples, images, code samples, and even gifs.
If you are looking for older product updates, refer to the following locations.
You can now easily enable Real User Monitoring (RUM) monitoring for your hostnames, while safely dropping requests from visitors in the European Union to comply with GDPR and CCPA.
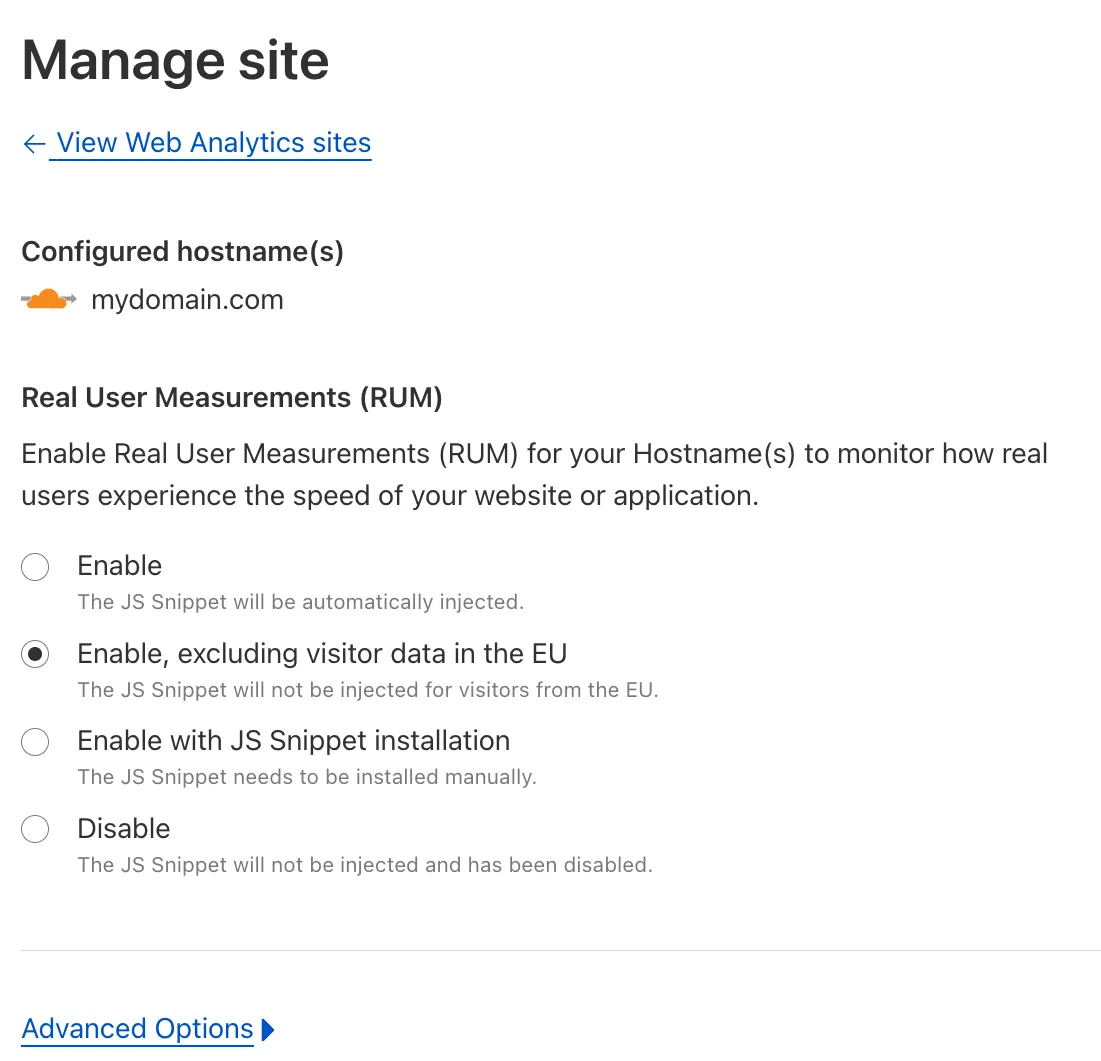
Our Web Analytics product has always been centered on giving you insights into your users' experience that you need to provide the best quality experience, without sacrificing user privacy in the process.
To help with that aim, you can now selectively enable RUM monitoring for your hostname and exclude EU visitor data in a single click. If you opt for this option, we will drop all metrics collected by our EU data centers automatically.
You can learn more about what metrics are reported by Web Analytics and how it is collected in the Web Analytics documentation. You can enable Web Analytics on any hostname by going to the Web Analytics ↗ section of the dashboard, selecting "Manage Site" for the hostname you want to monitor, and choosing the appropriate enablement option.