
Pular para o conteúdo

Changelog

New updates and improvements at Cloudflare.

Cloud Observatory connection metrics improvements

The Cloud Observatory on Radar now provides improved connection metric insights, offering new ways to explore TCP round-trip time, TCP handshake duration, TLS handshake duration, and response header receive duration across cloud provider origin servers.

The Cloud Observatory overview now shows connection metrics broken down by cloud provider, making it easy to compare connection performance across Amazon Web Services, Google Cloud, Microsoft Azure, and Oracle Cloud.
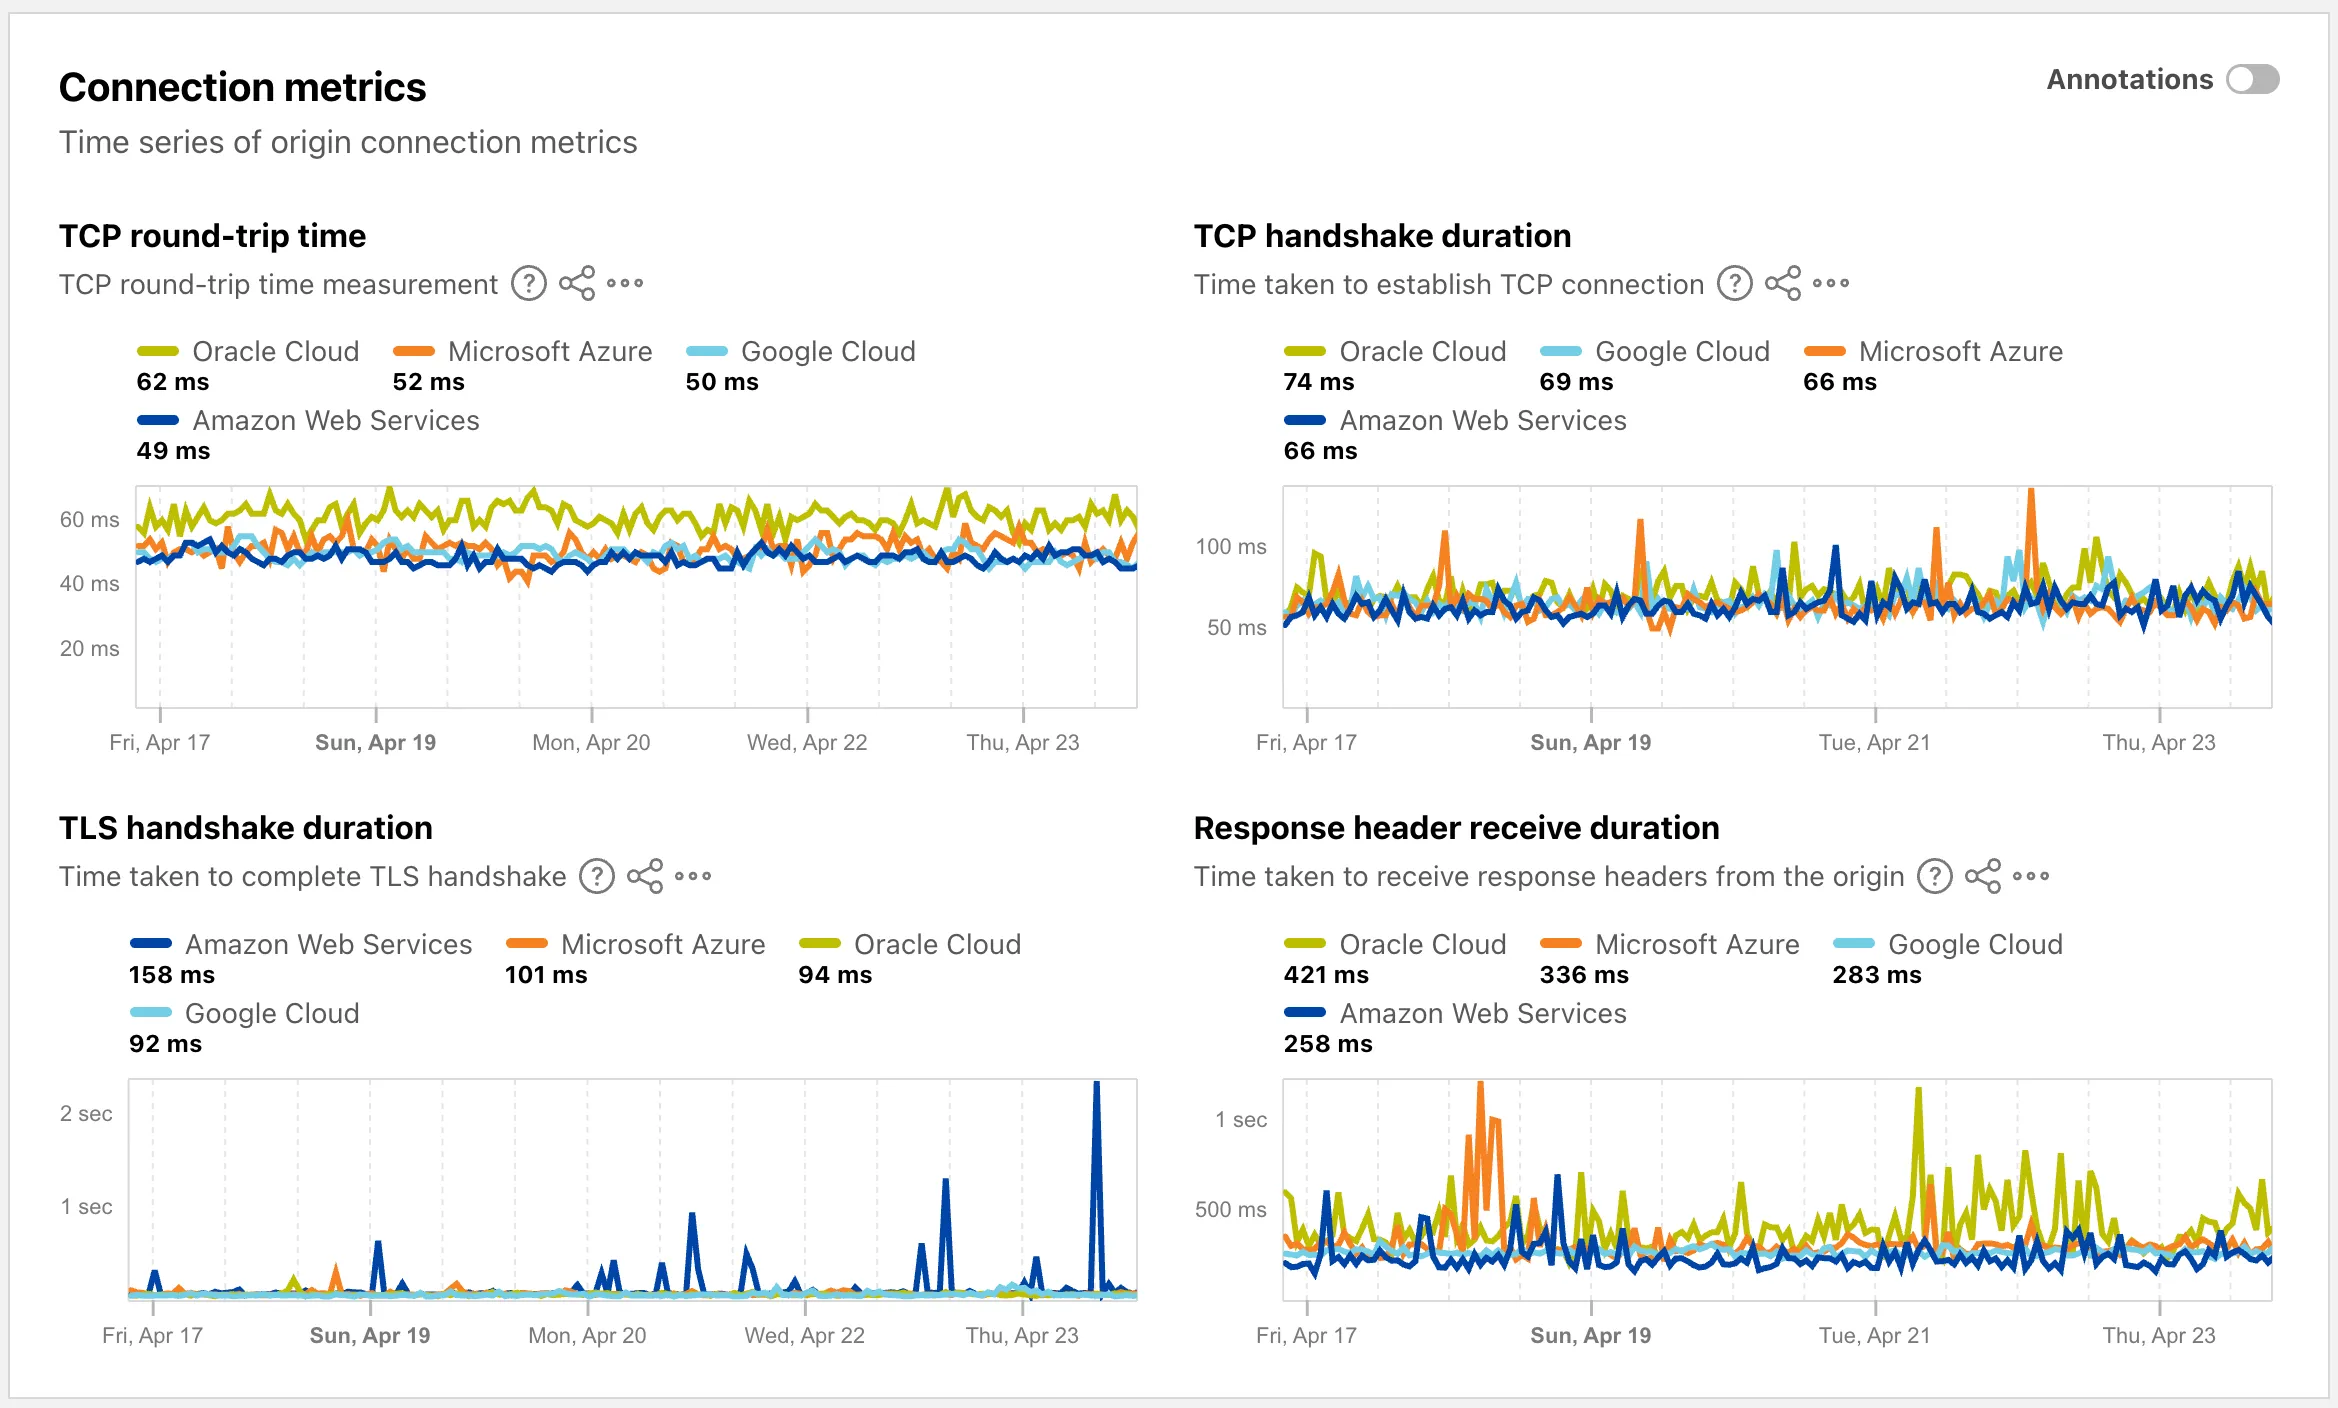
Screenshot of Cloud Observatory connection metrics broken down by cloud provider

Each provider page now shows connection metrics for the top five regions, with a selector to rank by lowest or highest values.
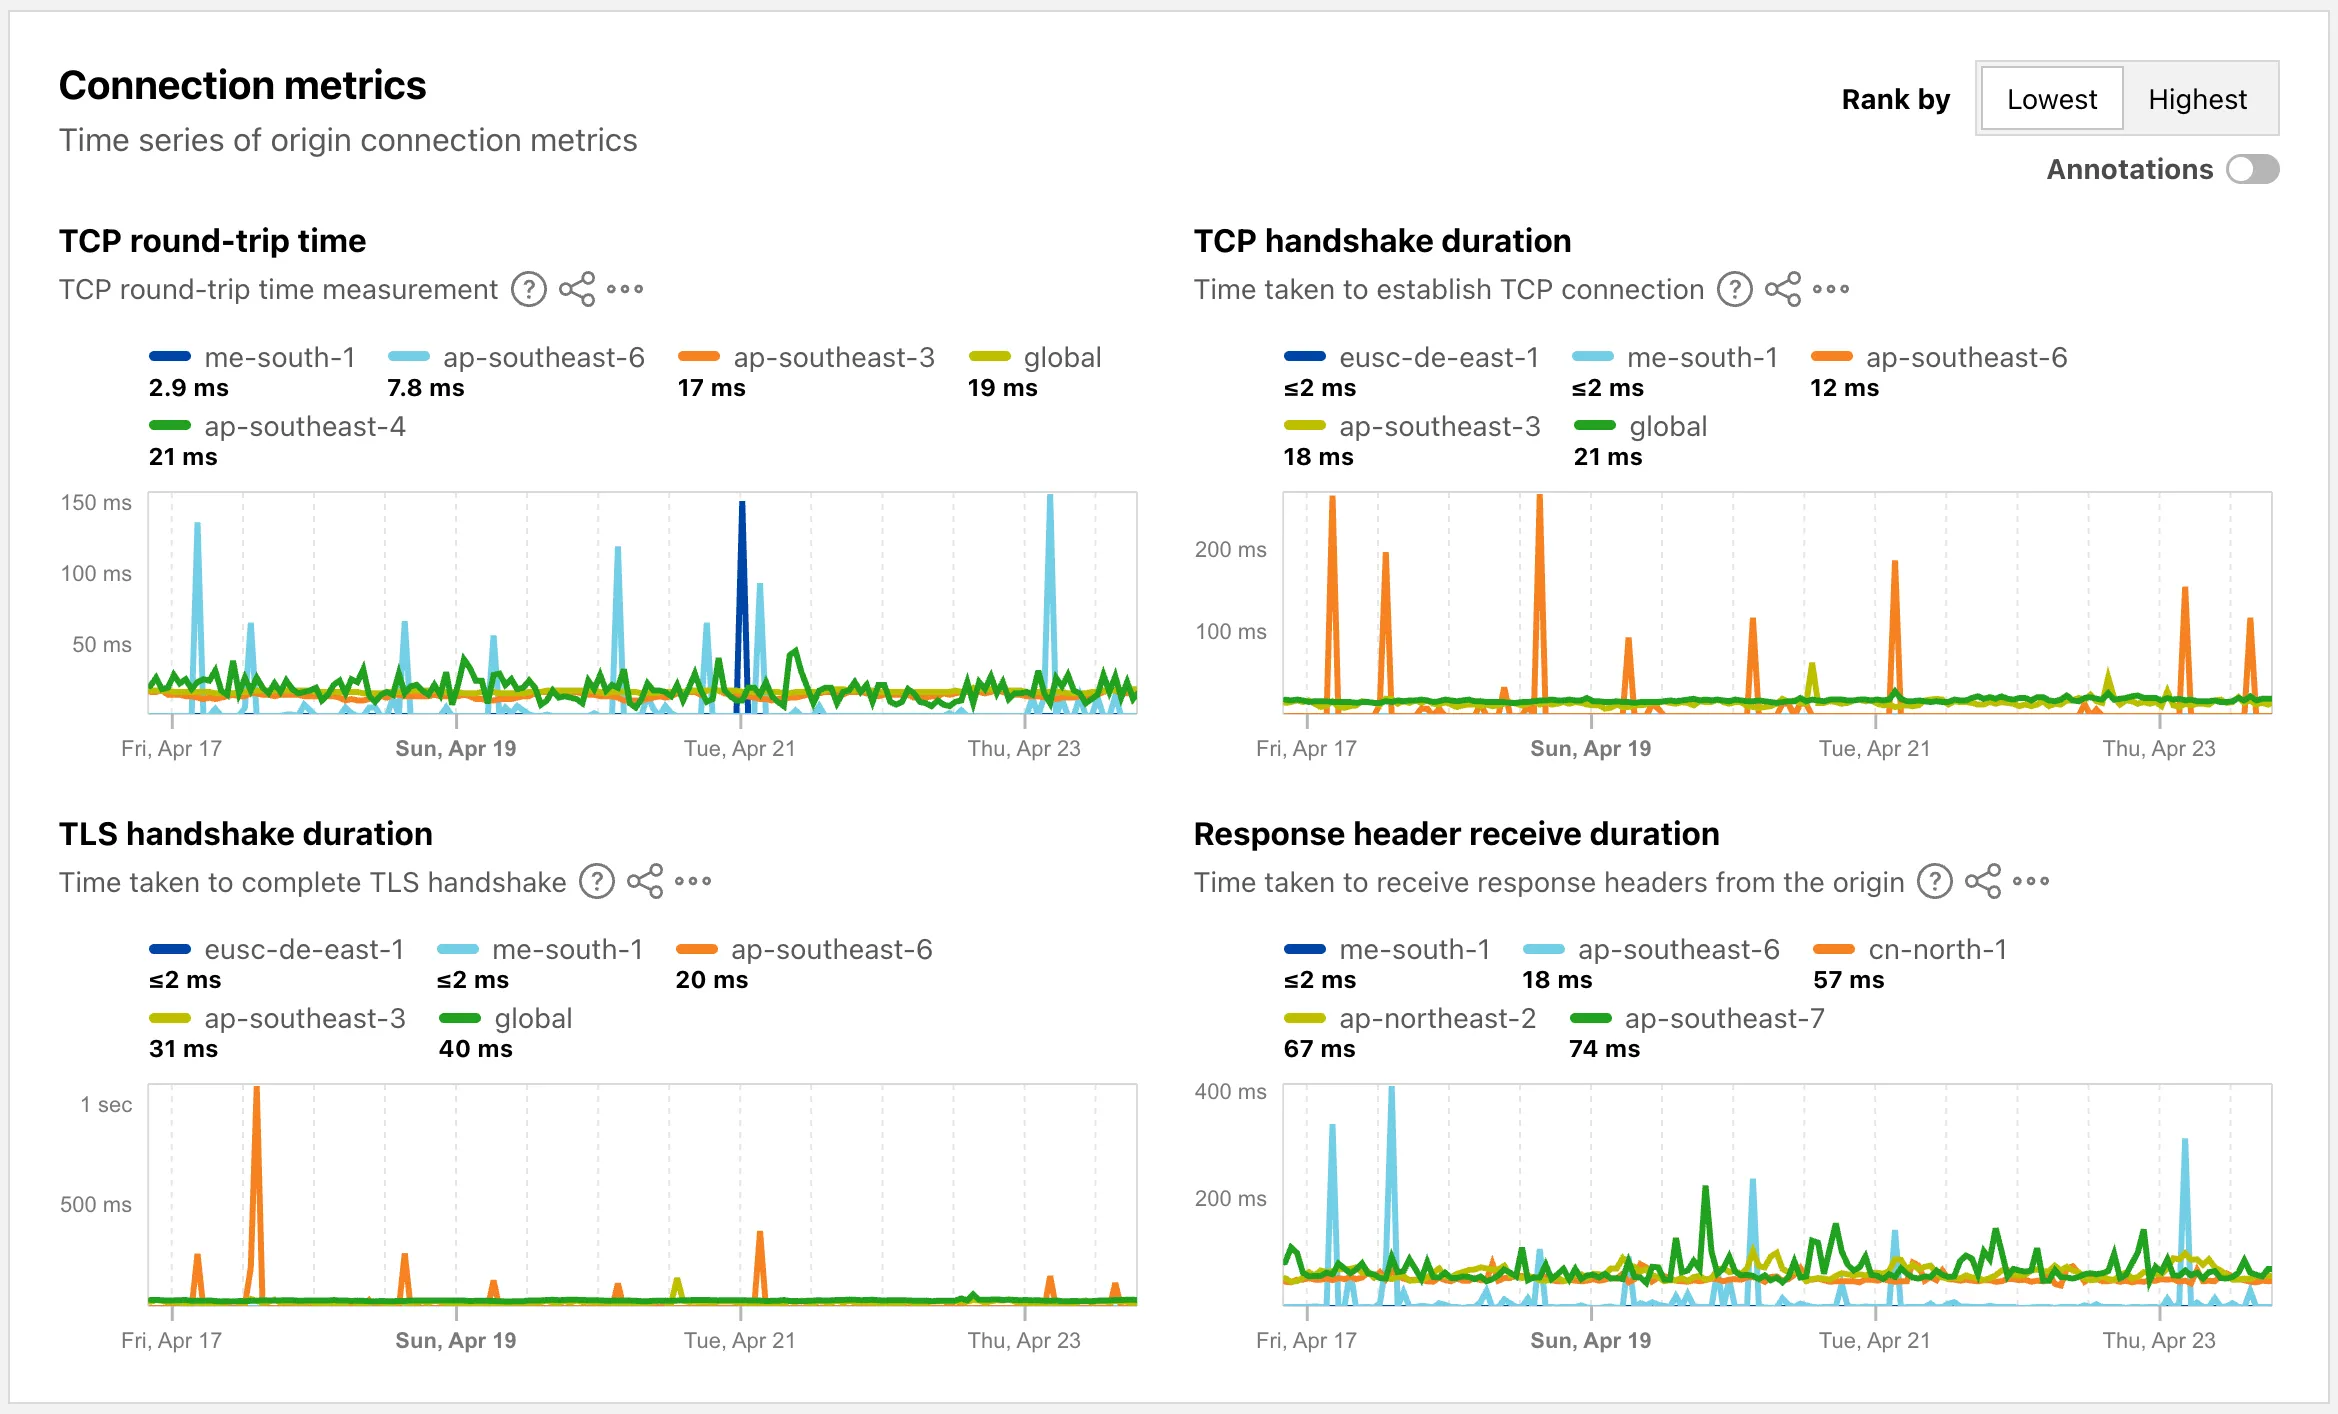
Screenshot of Cloud Observatory connection metrics broken down by region for a provider

Each region page now displays connection metrics as percentile distributions (25th percentile, median, and 75th percentile), providing insight into the range and variability of connection times.
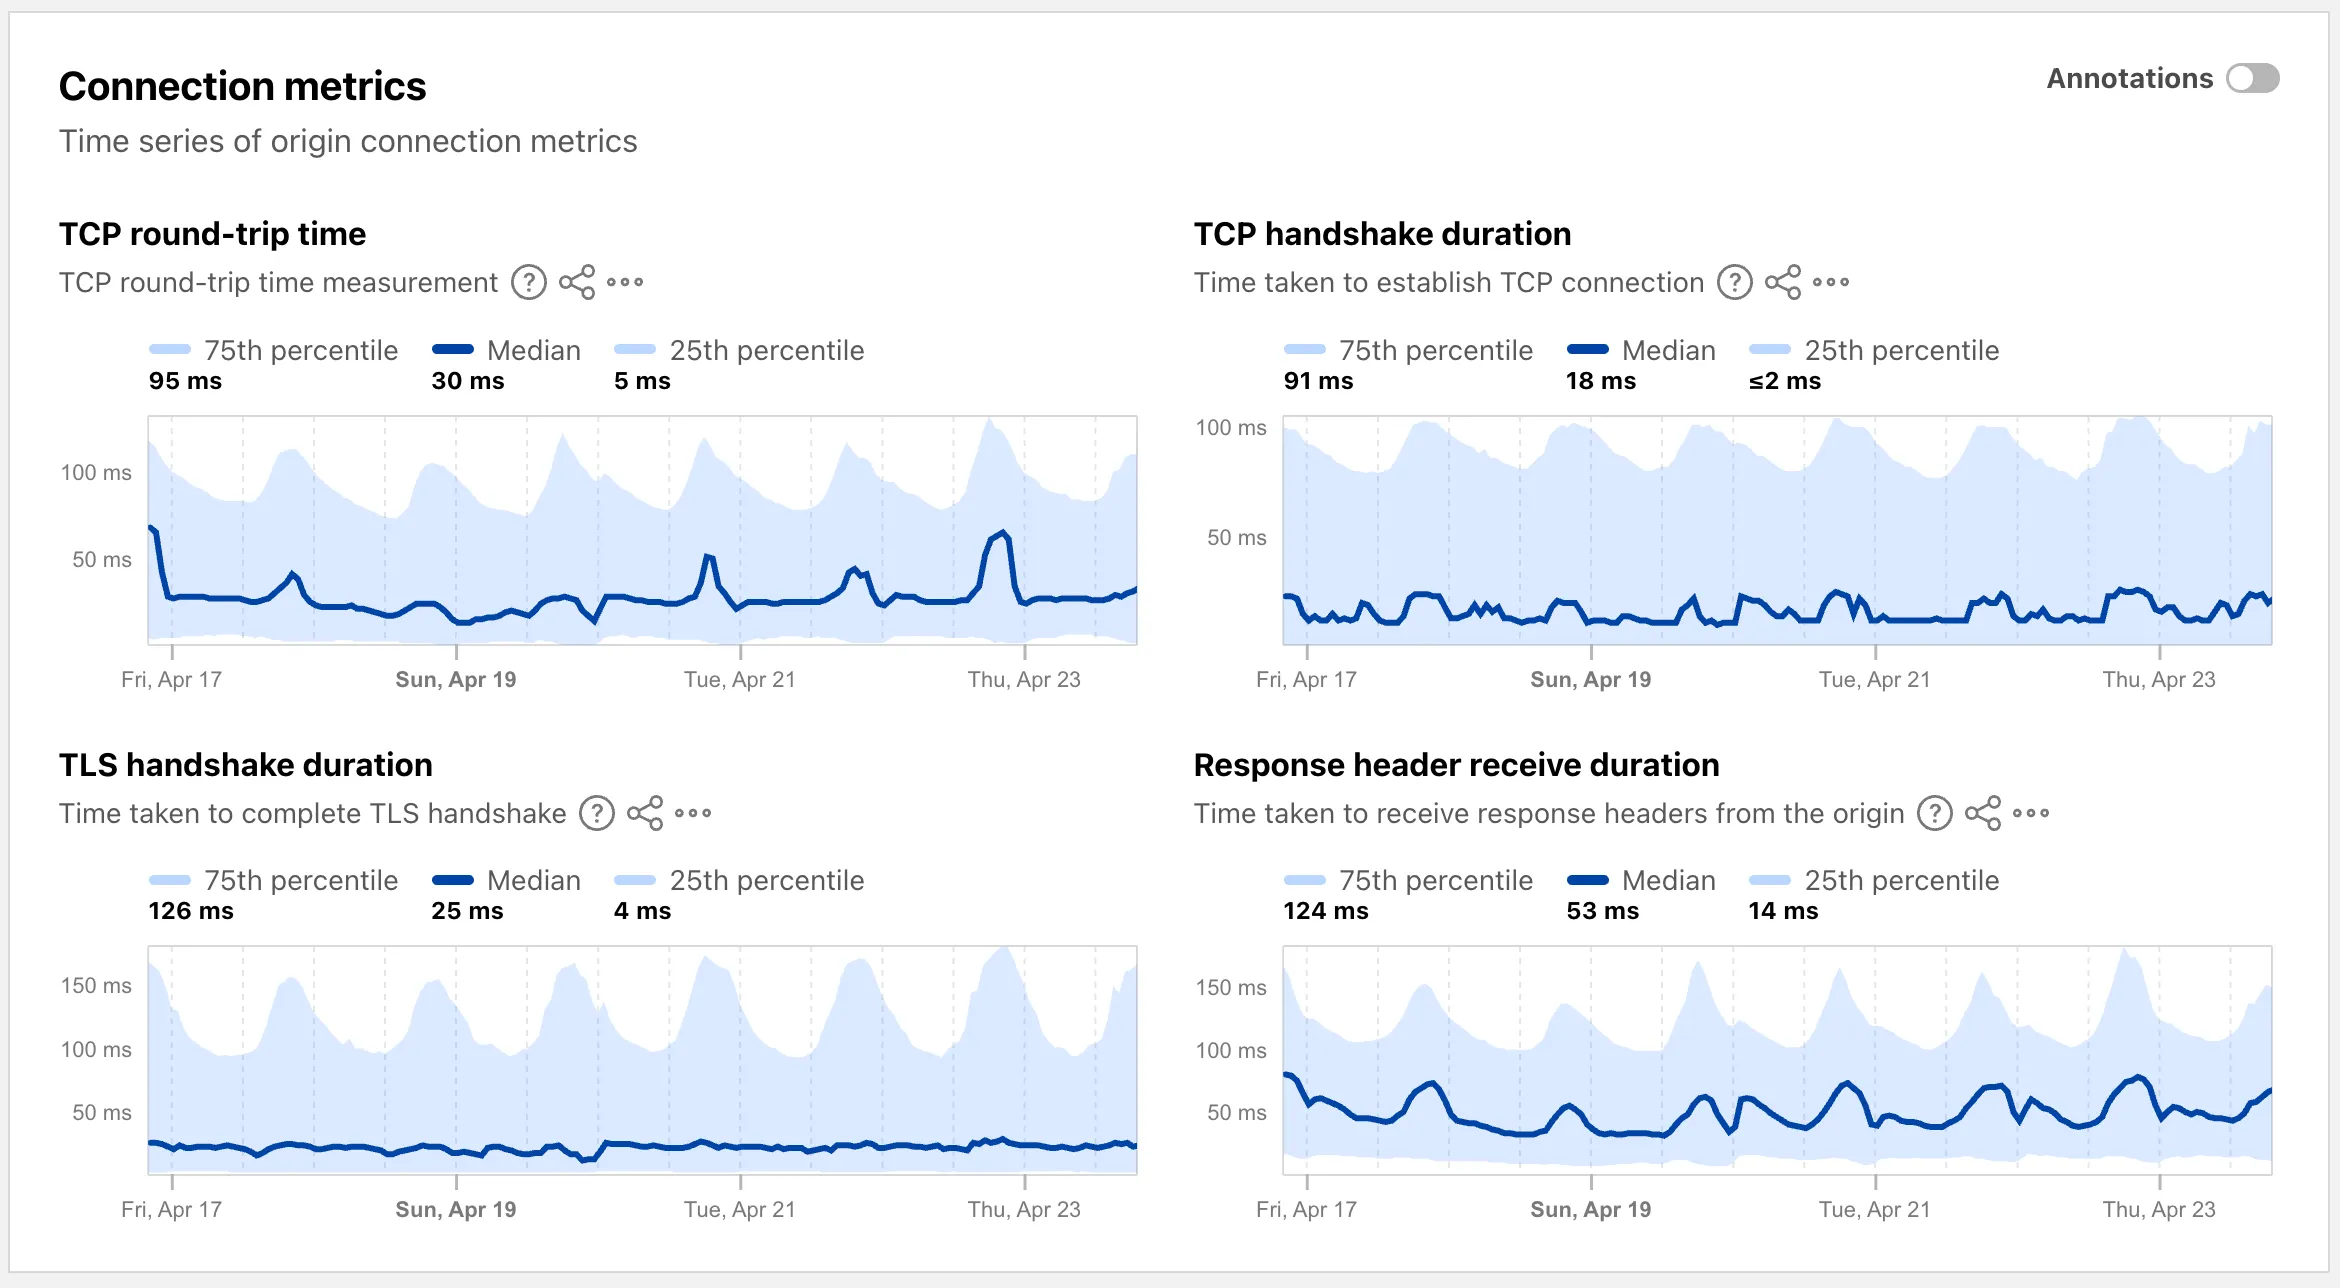
Screenshot of Cloud Observatory connection metrics with percentile distribution for a region

These views are also available through the Origins API, using the timeseries_groups endpoint with the ORIGIN, REGION, or PERCENTILE dimension.
Dark mode support on Cloudflare Radar

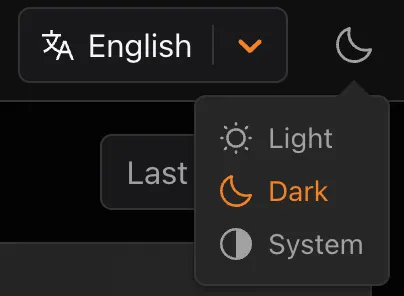
Radar now supports dark mode. A theme selector in the upper right corner of the page lets users explicitly choose between three display options:

  • Light — standard light theme
  • Dark — full dark theme
  • System — follows the operating system preference
Screenshot of the theme selector showing Light, Dark, and System options

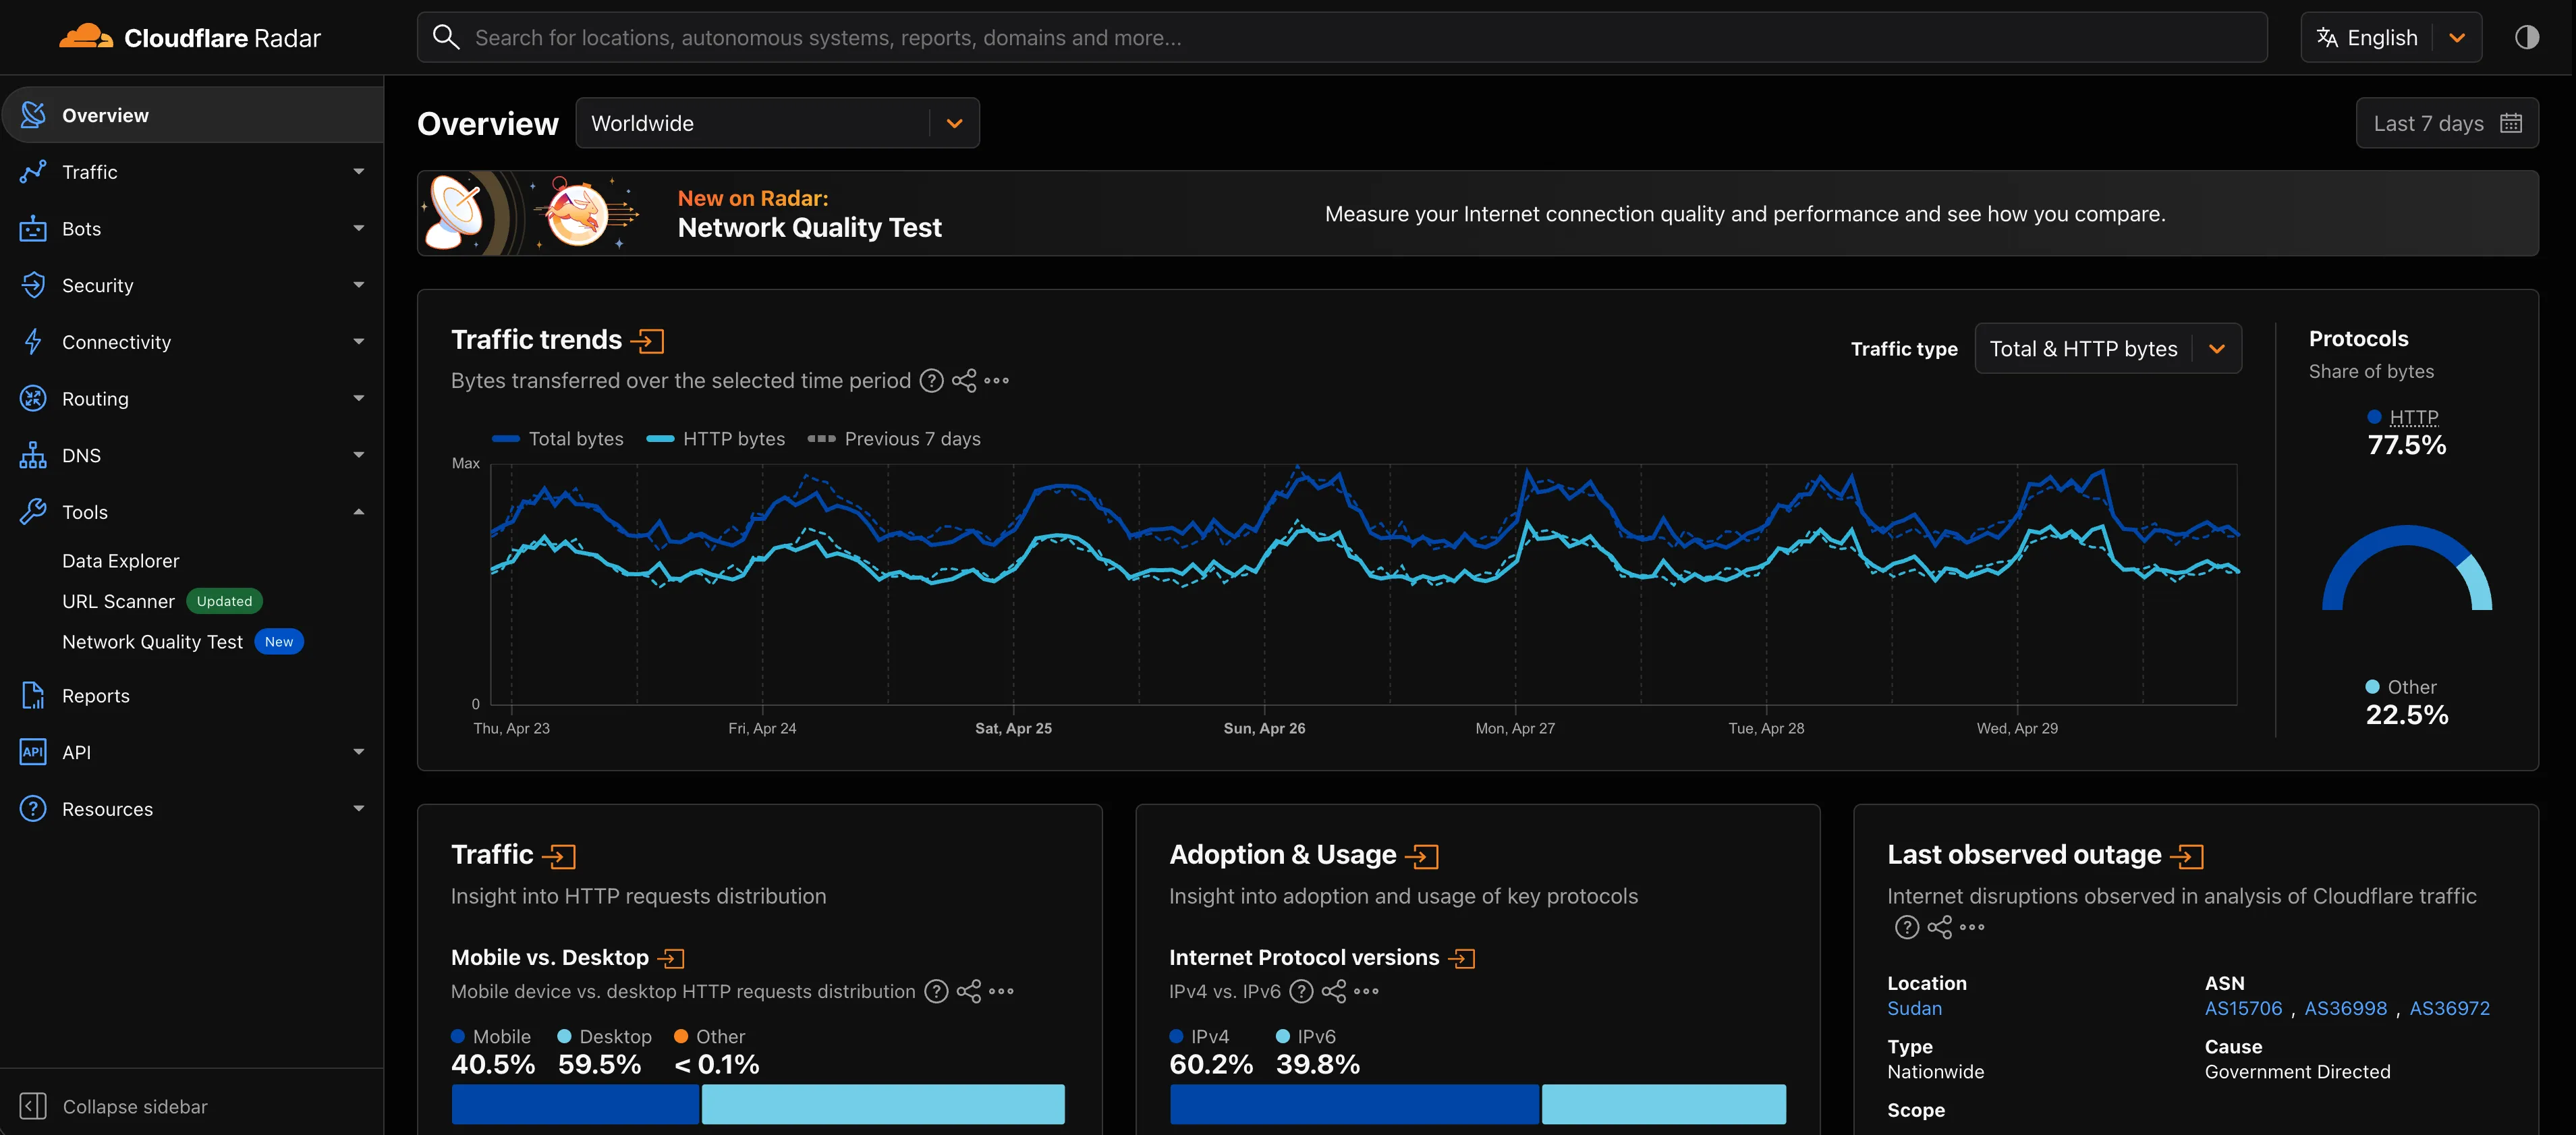
The selected theme applies consistently across all Radar pages and widgets.

Screenshot of the Cloudflare Radar overview page in dark mode

The theme choice also applies to shared and embedded graphs.

Try it out at Cloudflare Radar.

Web Analytics adds Navigation Type filtering and reporting

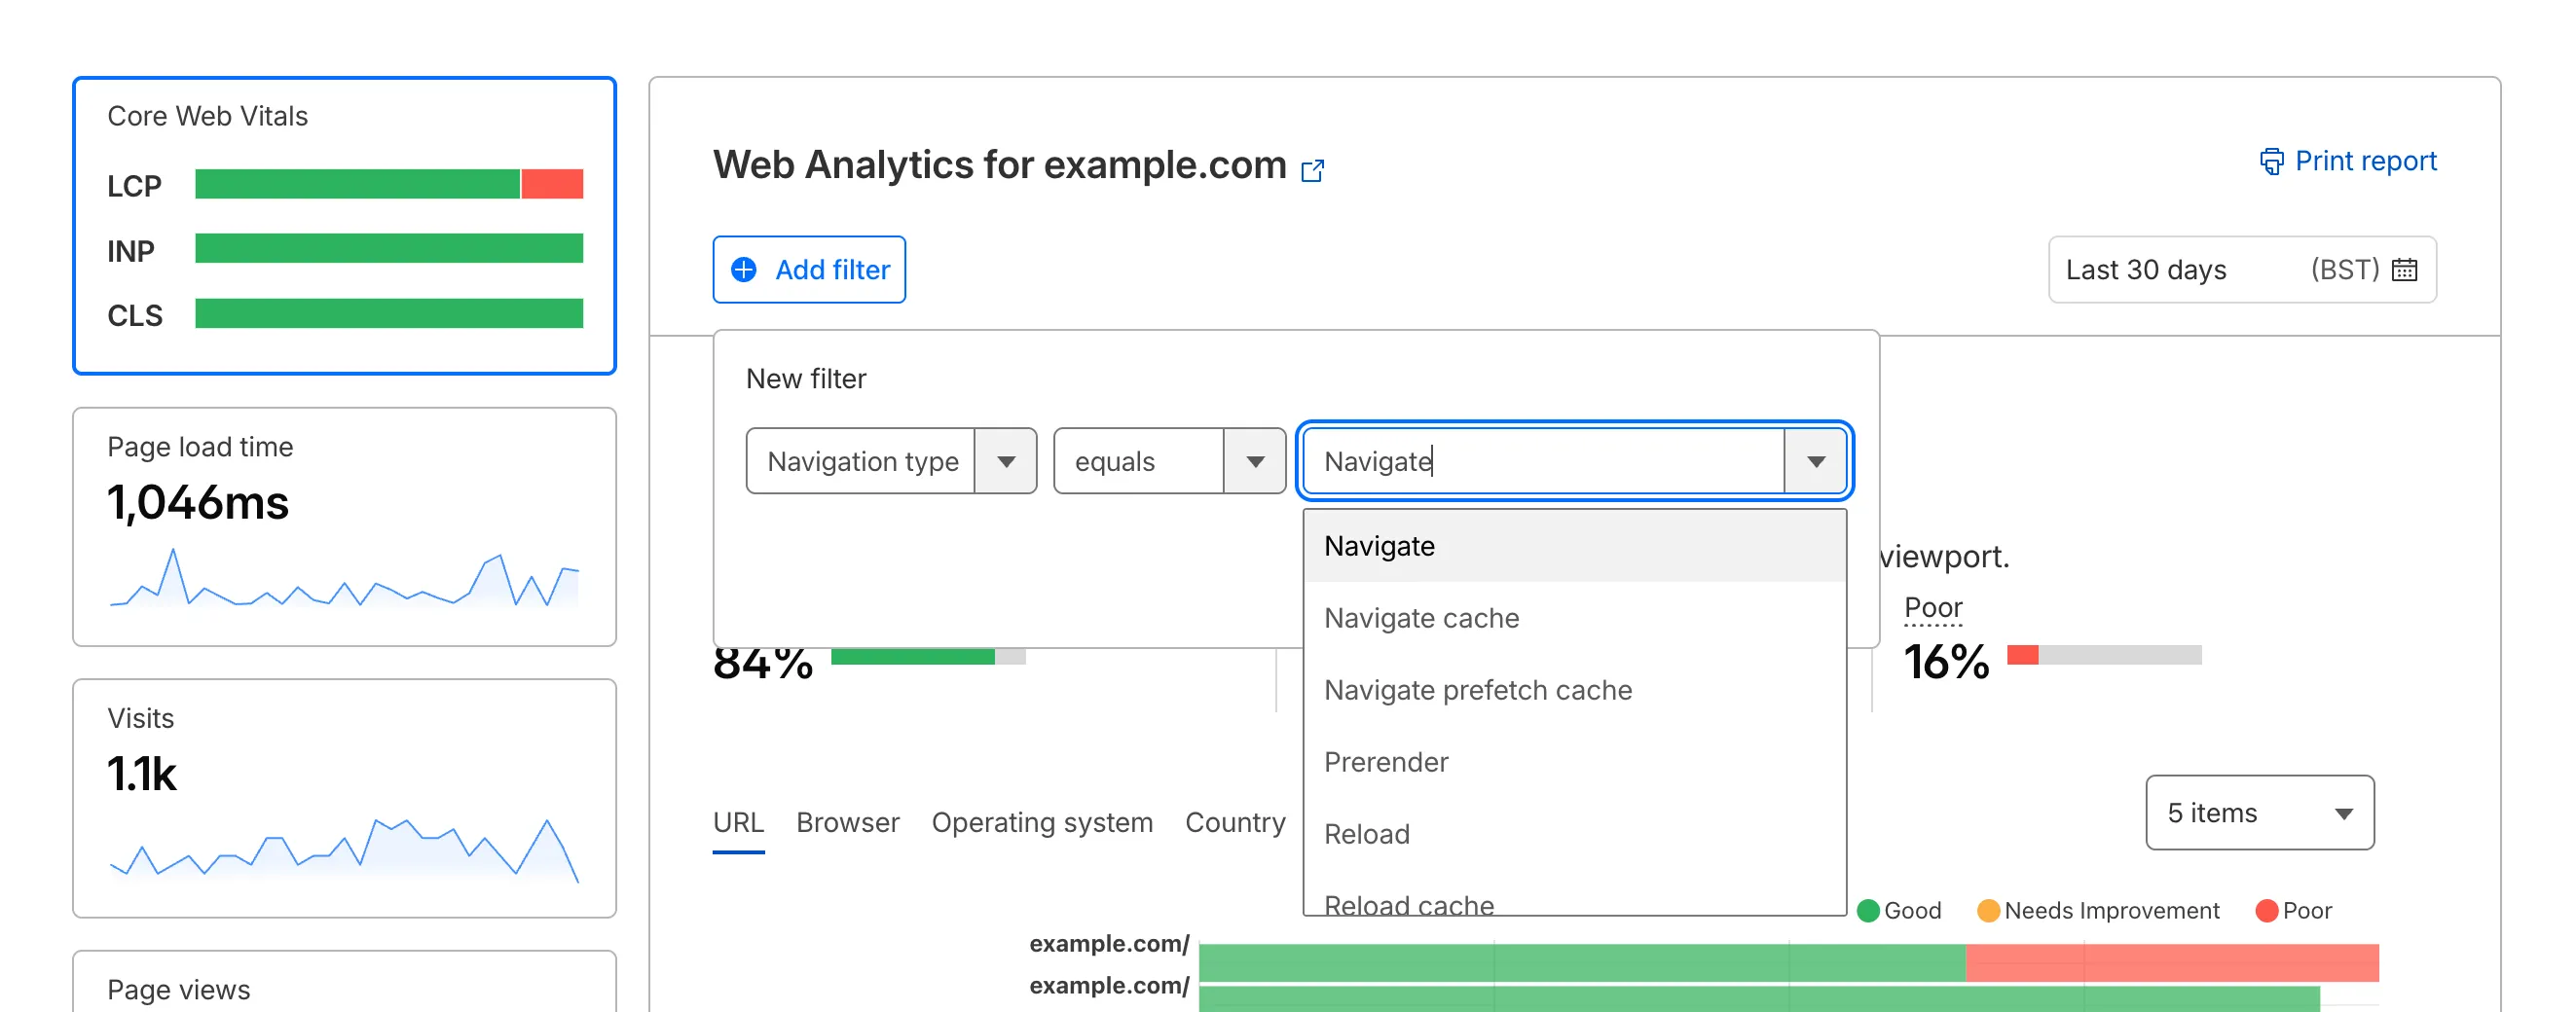
Cloudflare Web Analytics now supports Navigation Type reporting and filtering.

This update allows developers and performance analysts to see how users are navigating between pages — whether through a link click or form submission, a page reload, or using the browser's back/forward buttons — and whether a browser cache hit occurred for these behaviors.

Understanding navigation types is critical for optimizing user experience. For example, if a high volume of your traffic consists of "Back-forward" navigations versus "Back-forward Cache", those visitors are not benefiting from the Back/Forward Cache (bfcache) and therefore are experiencing higher load times due to potentially unnecessary network requests.

The same applies for regular "Navigate" entries — where "Navigate Cache", "Navigate Prefetch Cache" and "Prerender" would provide instant document retrieval — and "Reload", where "Reload cache" would be more optimal.

A high volume of "Reload" entries can also indicate a potential stability problem with your website.

By identifying these patterns, you can tune your browser caching strategies to ensure HTML documents are served instantaneously from local caches rather than requiring a roundtrip to the network.

For more information, refer to Navigation Types.

Key benefits

  • Monitor Cache Effectiveness: See how often your site is served from the HTTP cache or bfcache.
  • Identify Performance Bottlenecks: Filter by the different types to understand performance opportunity of improving browser cache hit ratio.

Analyze navigation types in the Cloudflare dashboard

You can now find the Navigation Type dimension in the Web Analytics dashboard. You can filter to include/exclude one or more specific types using "equals", "does not equal", "in", or "not in" matchers.

Navigation Type filter

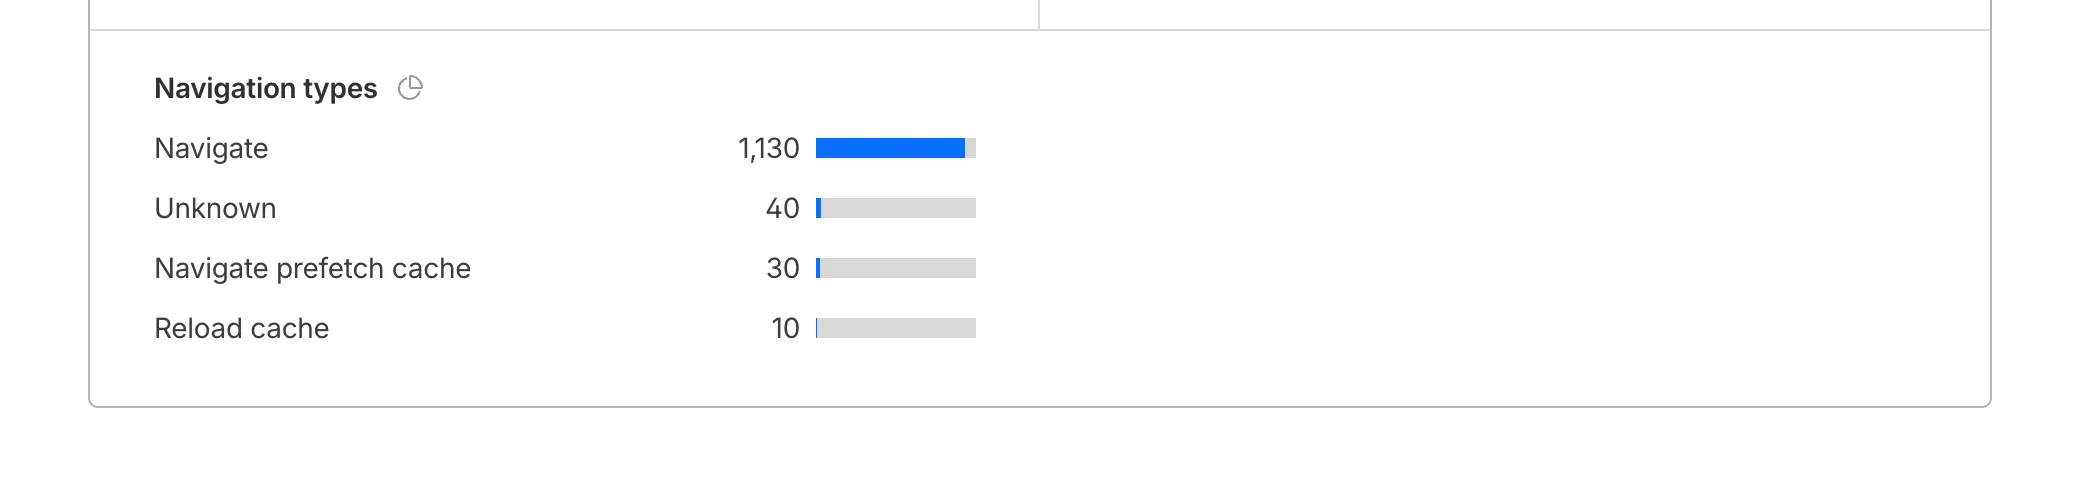
To check the list of popular navigation types, select Page views on the Web Analytics sidebar and scroll down to the bottom:

Navigation Types list in Page Views tab

Digital experience tests to authenticated resources and enhanced configuration

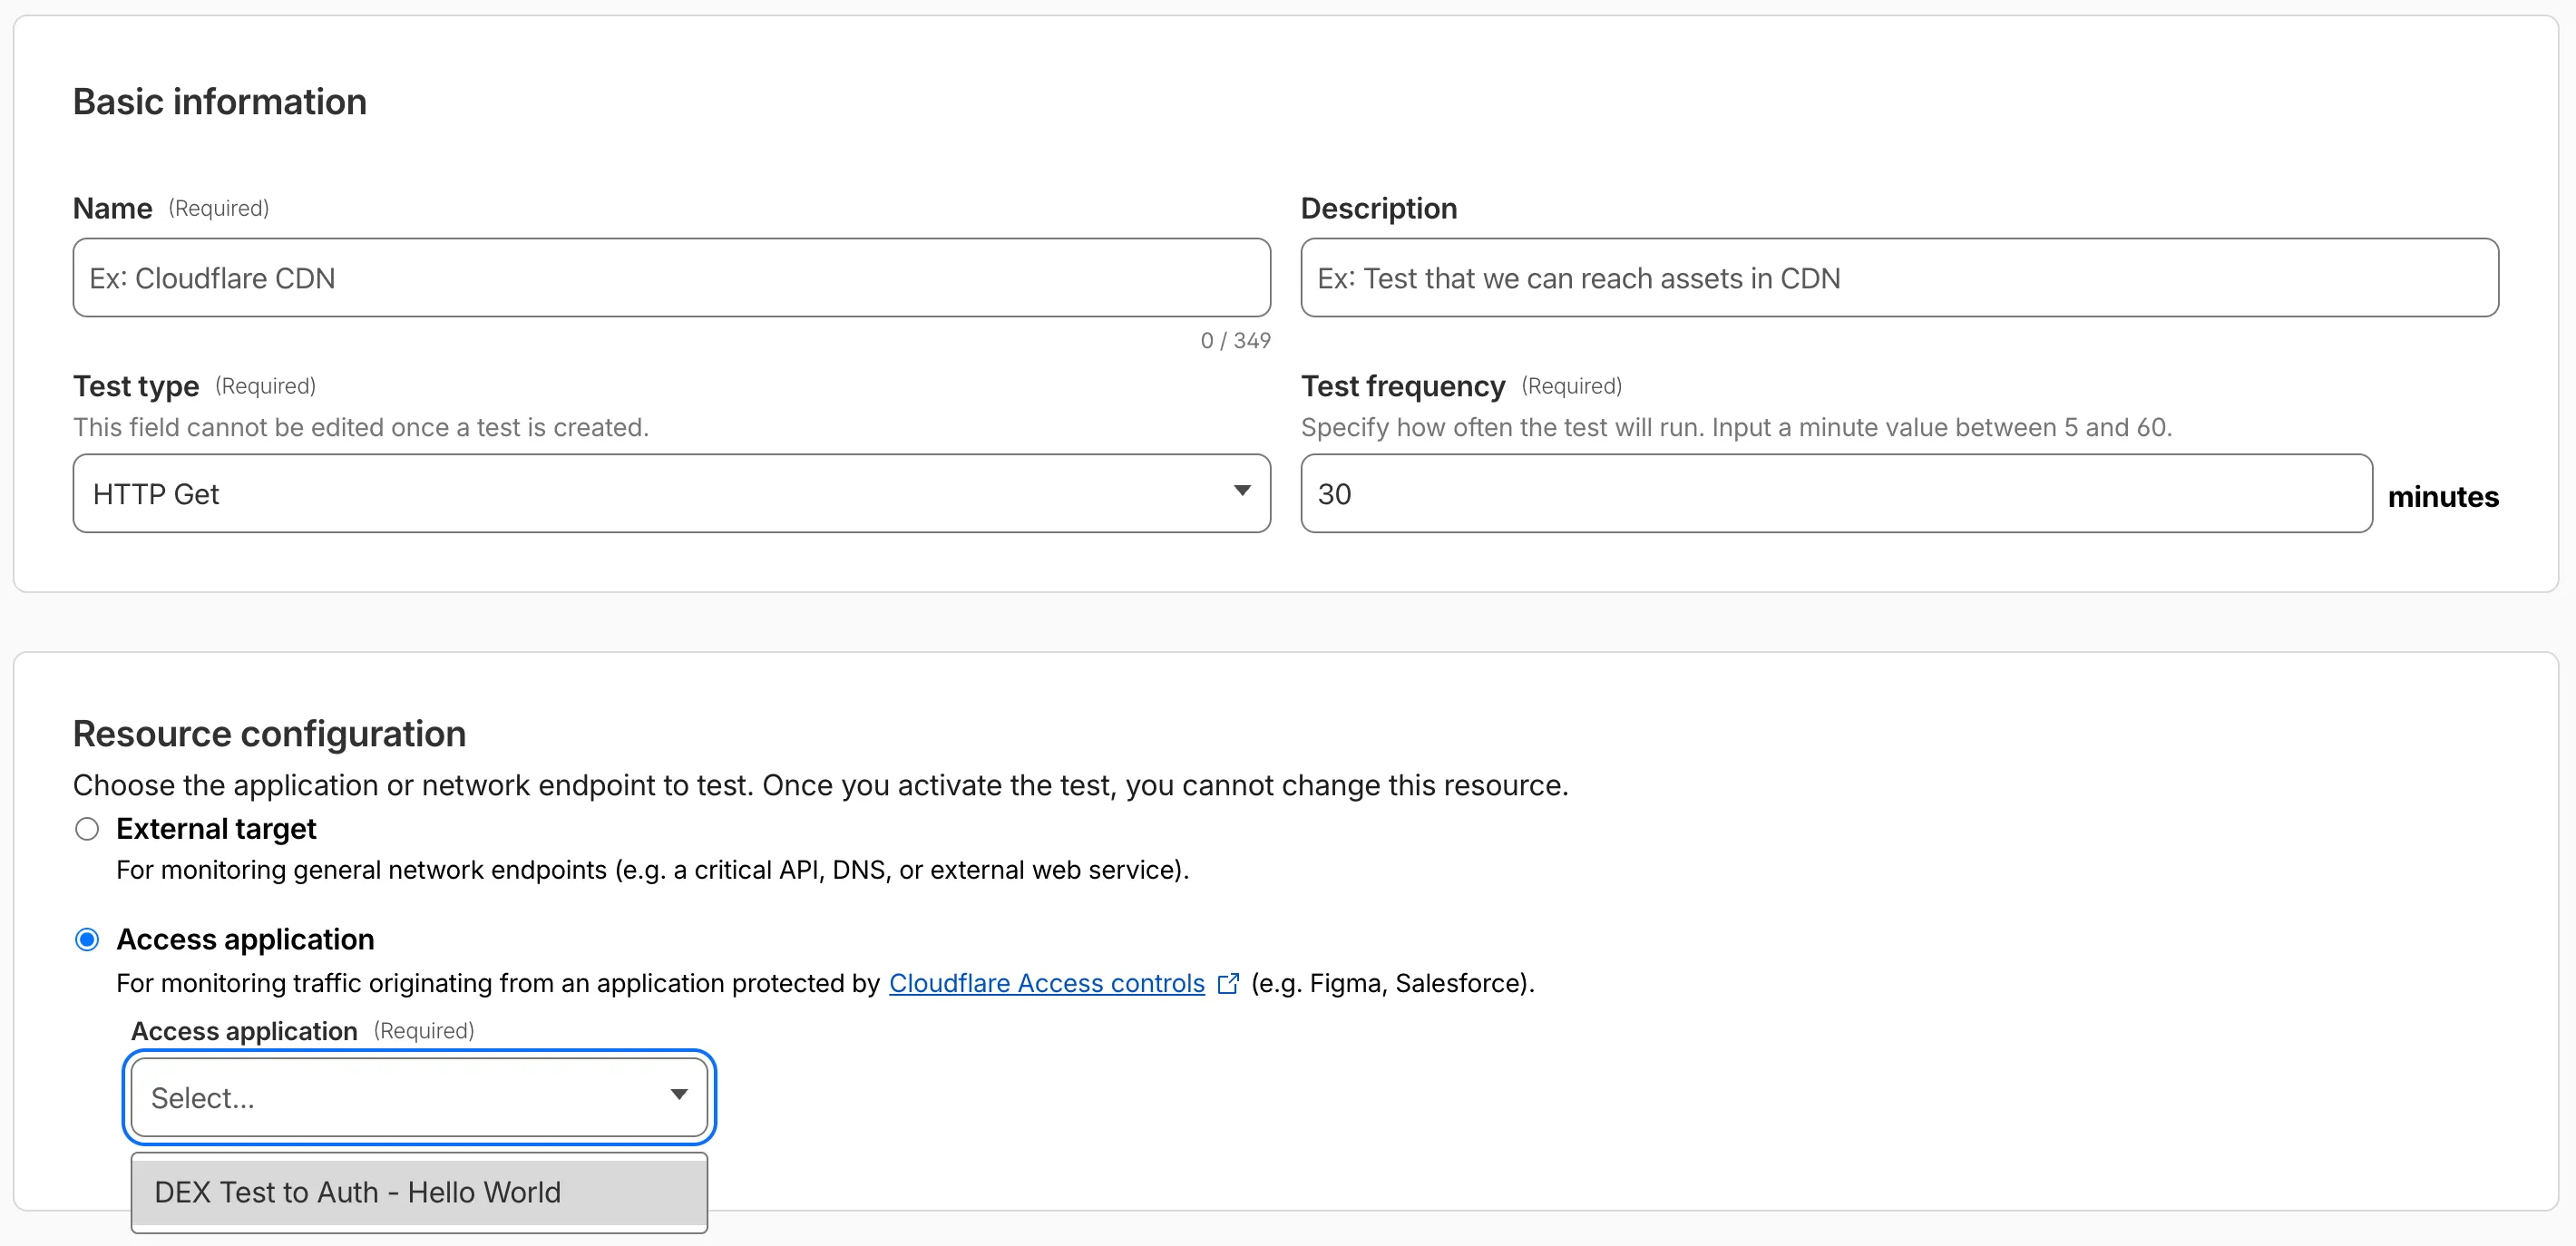
Digital experience tests now support testing applications protected by Cloudflare Access or third-party authentication. All authentication secrets are managed via Cloudflare Secret Store.

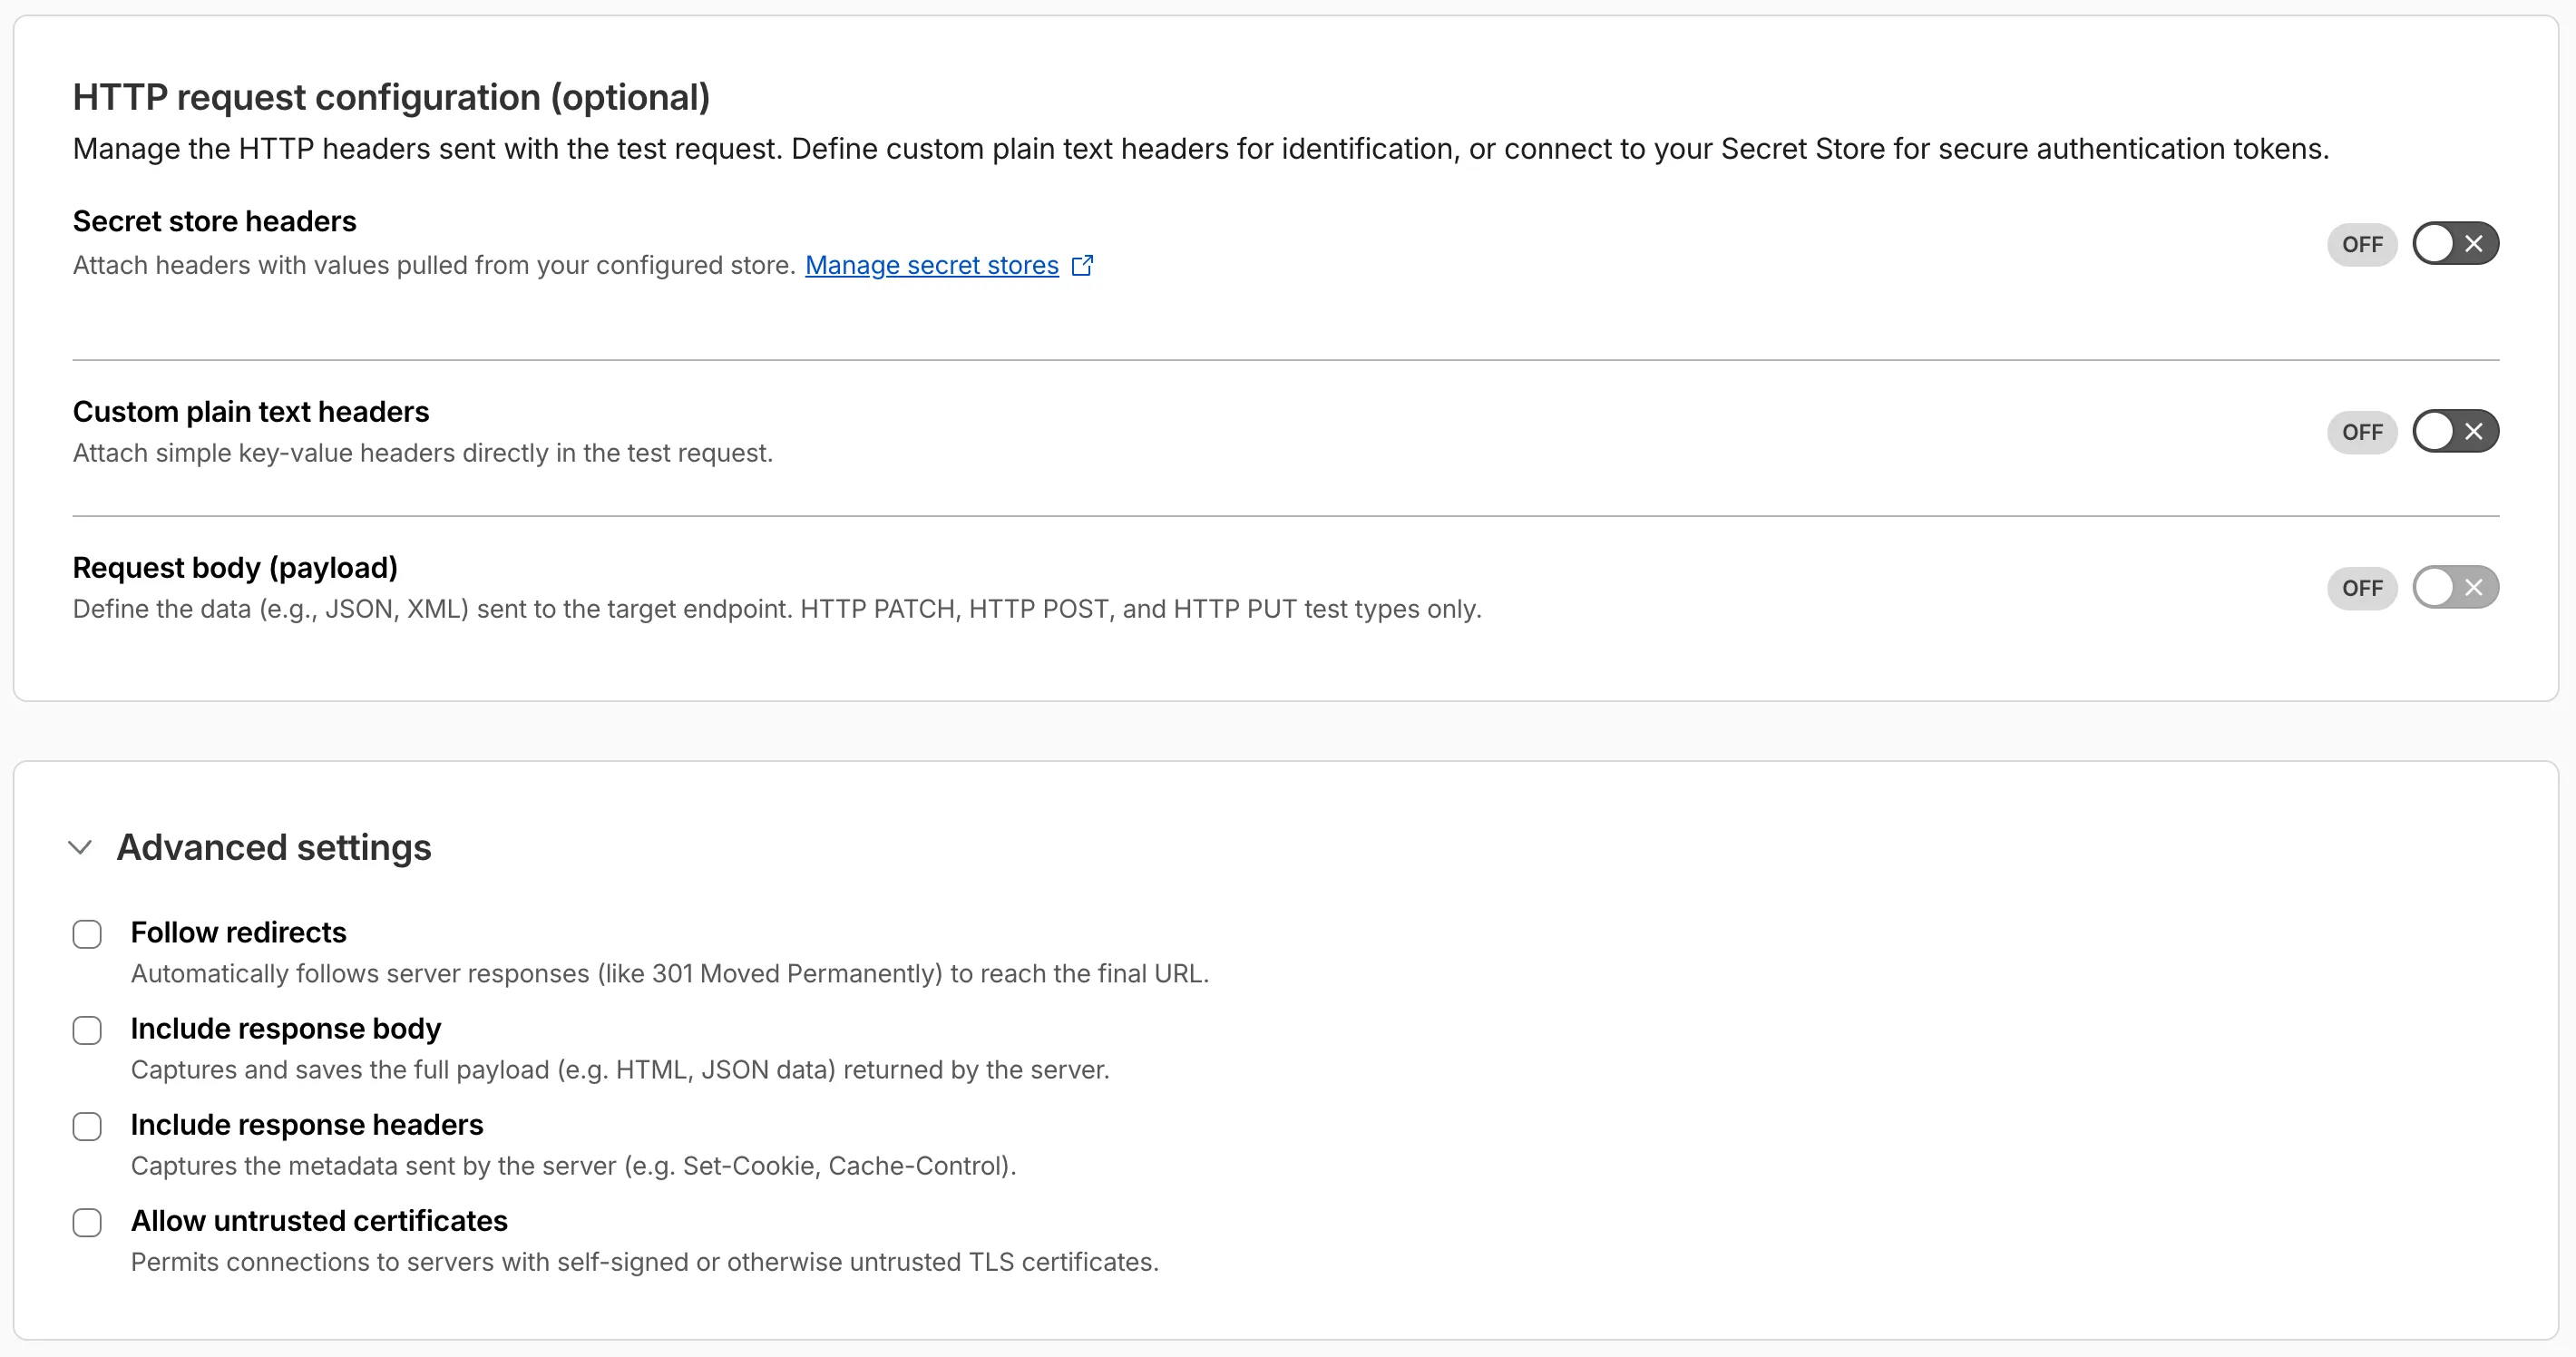
Digital experience tests also have enhanced configuration options including:

  • New HTTP methods (DELETE, PATCH, POST, PUT)
  • Secret Store headers, custom plain text headers, and custom request bodies
  • Advanced settings: follow redirects, response bodies, response headers, and allow untrusted certificates
Digital experience test configuration for Cloudflare Access applicationsDigital experience enhanced test configuration

Cloudflare One Client speed tests

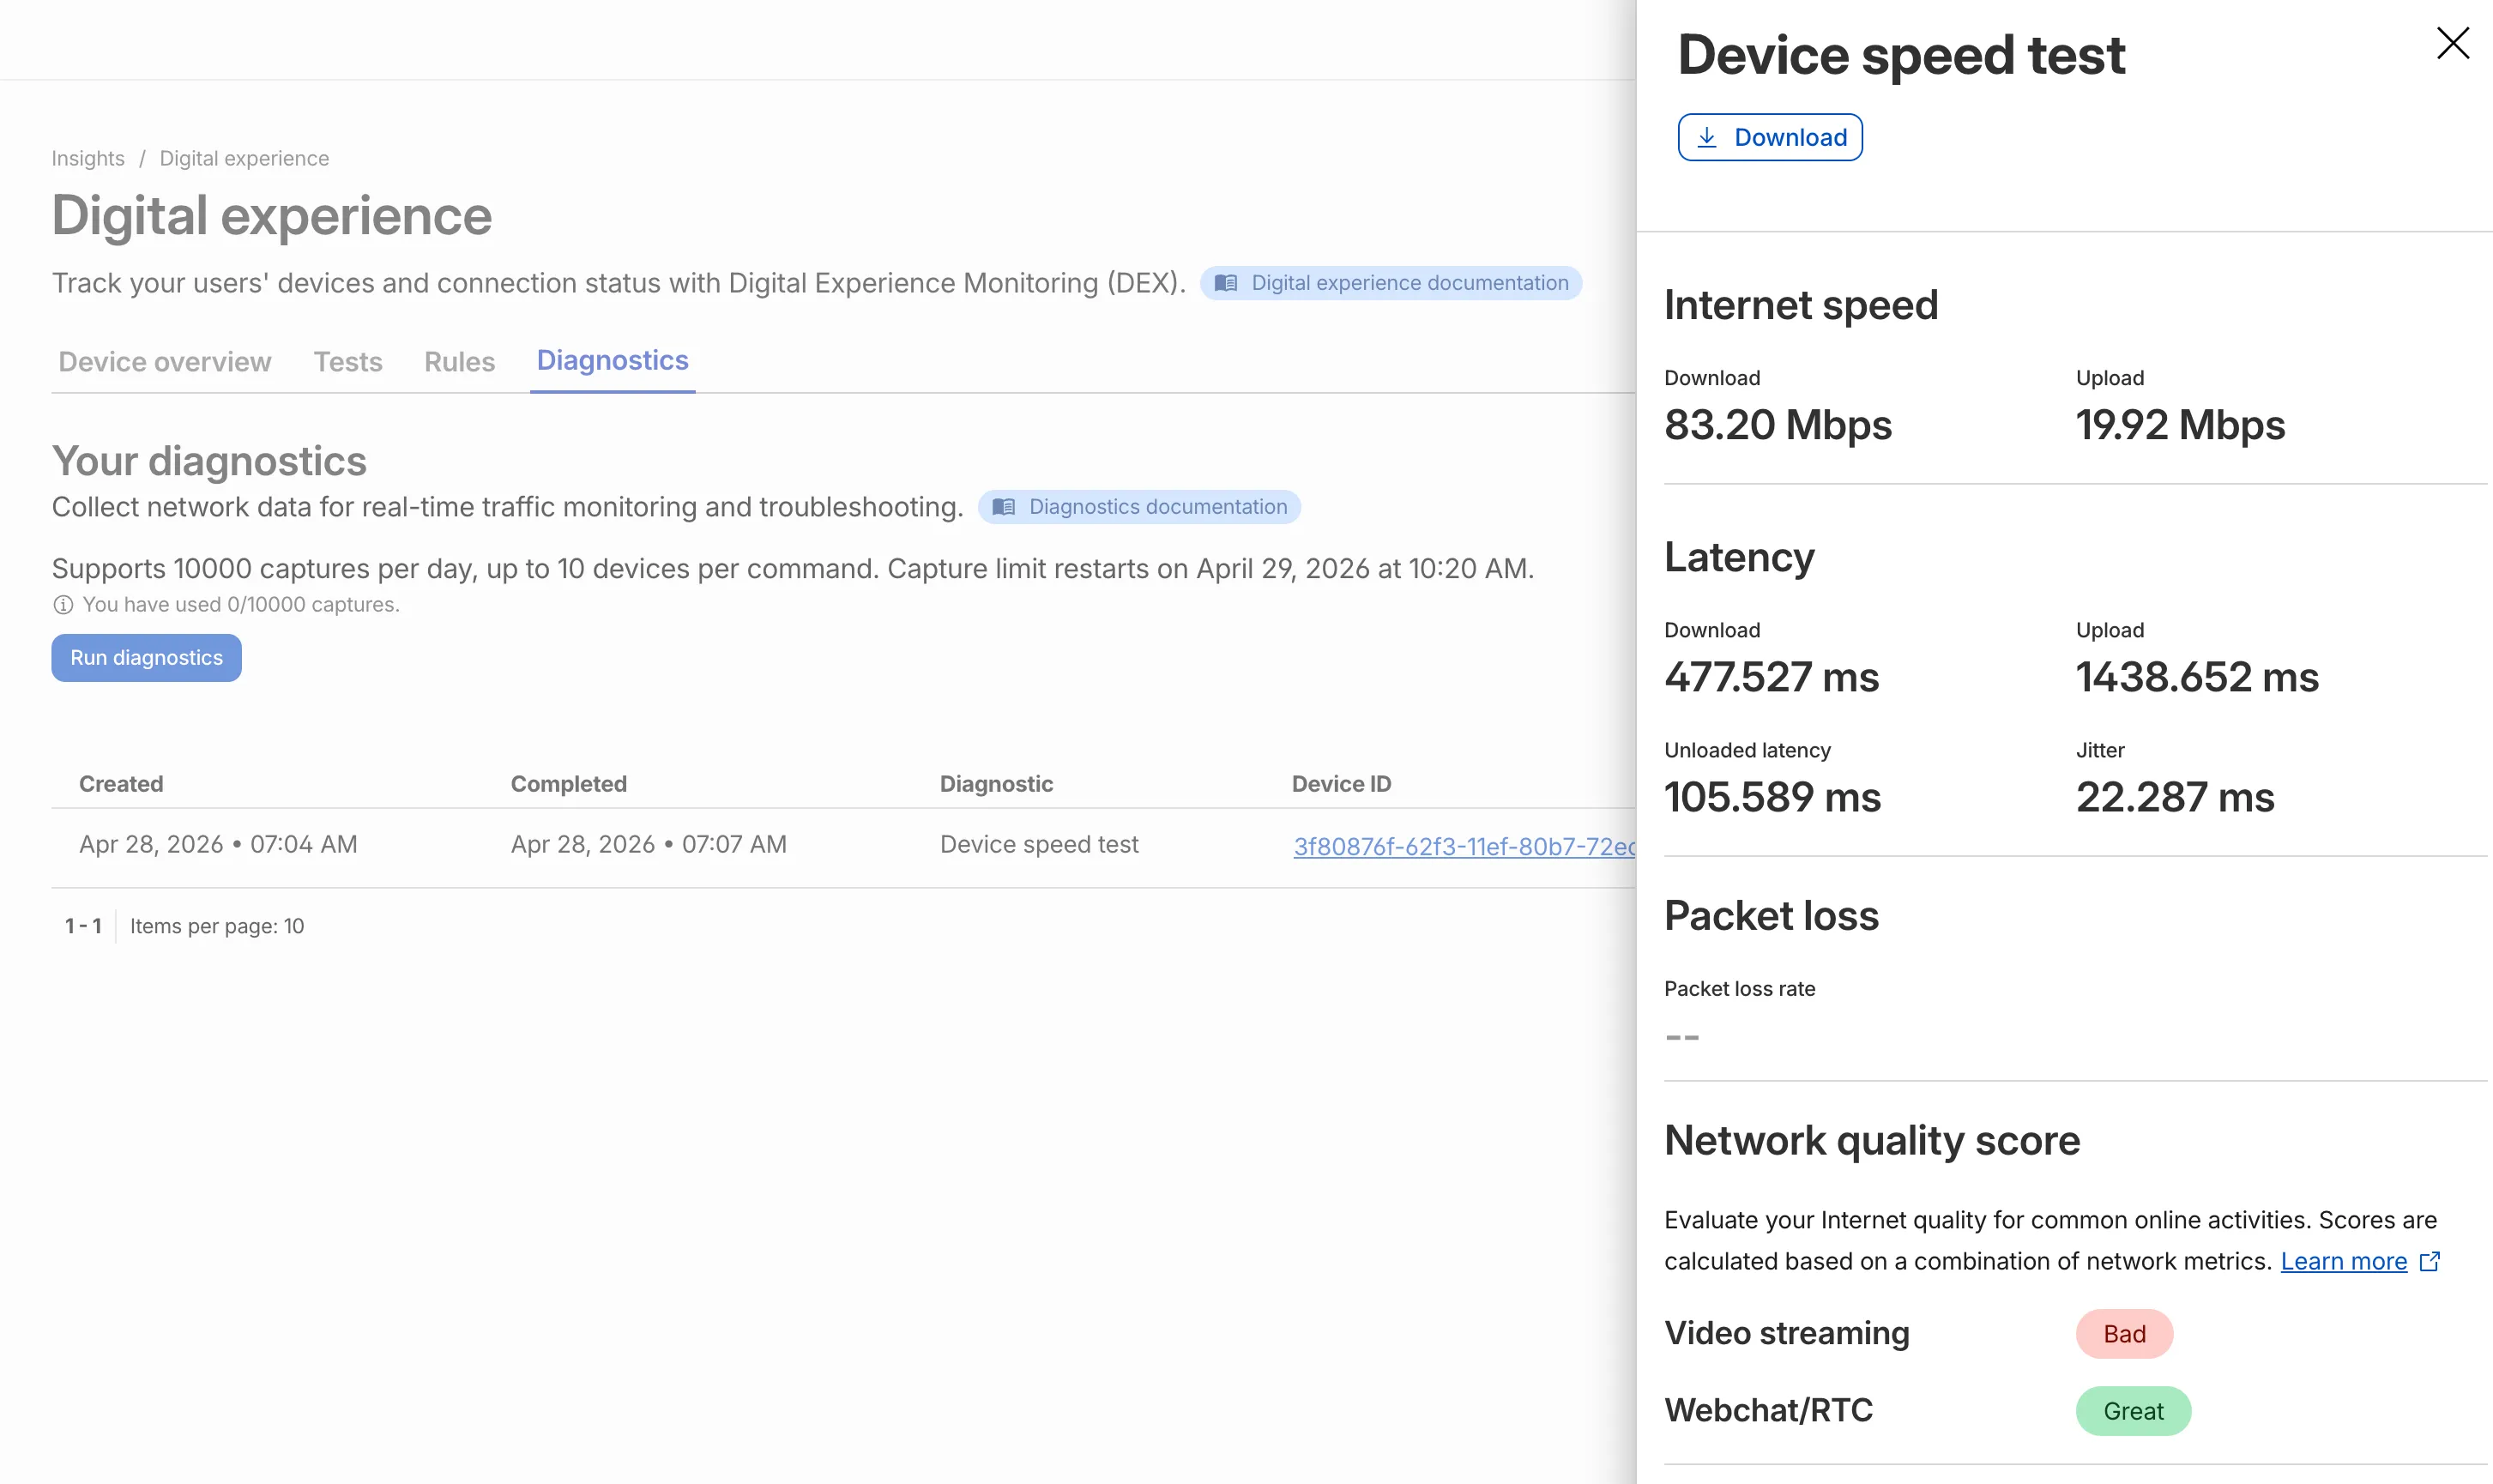
IT teams can now remotely run speed tests from the Cloudflare One Client to Cloudflare's network edge.

Each speed test includes the following metrics:

  • Internet speed: download and upload throughput
  • Latency: download, upload, unloaded latency, and jitter
  • Network quality score: video streaming, webchat/real-time communication (RTC)

In the Cloudflare dashboard, go to Zero Trust > Insights > Digital experience > Diagnostics and select Run diagnostics to use the feature today.

Cloudflare One client speed test result

Unified workspace for Brand Protection

We have introduced a unified investigation workspace within Brand Protection to help analysts manage complex brand portfolios. Instead of jumping between individual queries, you can now consolidate your workflow into a single, cohesive view.

What's new

  • You can now elect multiple saved queries from your dashboard to generate a consolidated "Combined Matches" view. This allows you to triage results from different brand queries in one unified table
  • You can open query extended views in distinct tabs within the Brand Protection dashboard. This enables you to maintain multiple investigation contexts simultaneously and switch between them without losing your place.
  • You can reset your workspace using the new "Clear Selection" action, making it easier to pivot between different investigation sets.

Key benefits

  • Eliminate fragmented workflows by viewing all matches across different query buckets in a single table, reducing the need to click through dozens of individual query pages
  • Correlate related campaigns by seeing similar domains or infrastructure patterns that appear across multiple saved queries

Learn more in our Brand Protection documentation.

Custom dashboards available to all customers

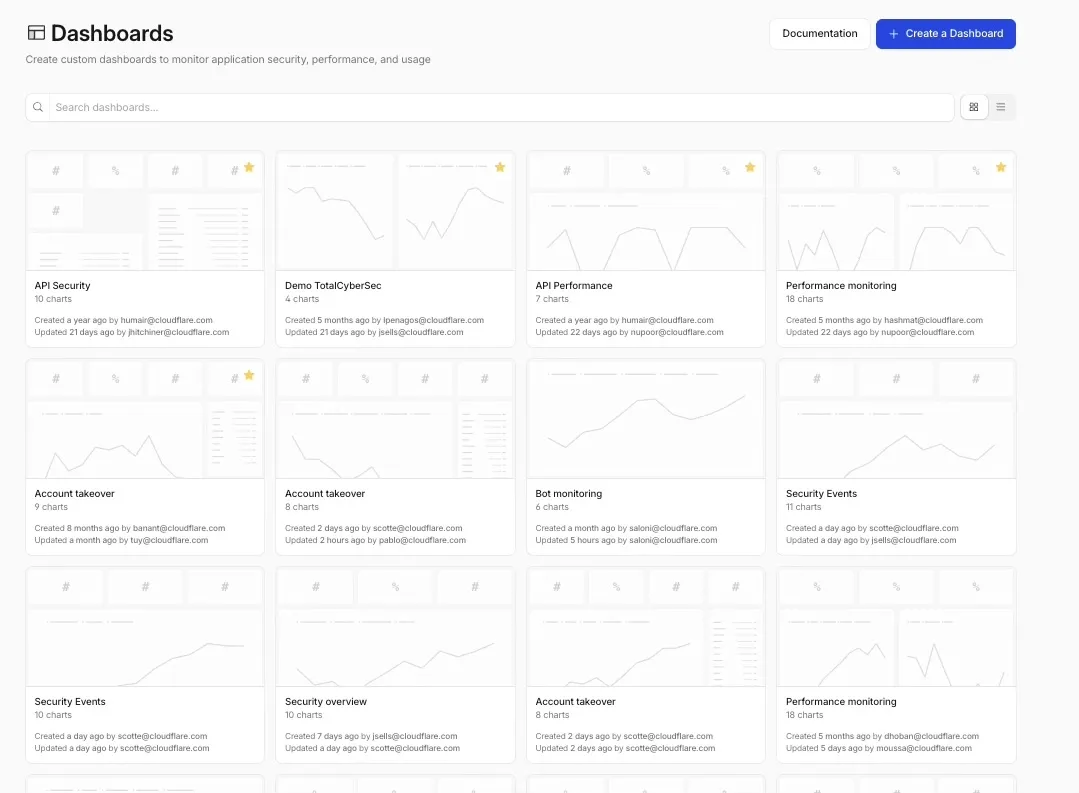
Custom Dashboards are now available to all Cloudflare customers. Build personalized views that highlight the metrics most critical to your infrastructure and security posture, moving beyond standard product dashboards.

This update significantly expands the data available for visualization. Build charts based on any of the 100+ datasets available via the Cloudflare GraphQL API, covering everything from WAF events and Workers metrics to Load Balancing and Zero Trust logs.

Log Explorer integration

For Log Explorer customers, you can now turn raw log queries directly into dashboard charts. When you identify a specific pattern or spike while investigating logs, save that query as a visualization to monitor those signals in real-time without leaving the dashboard.

Key benefits

  • Unified visibility: Consolidate signals from different Cloudflare products (for example, HTTP Traffic and R2 Storage) into a single view.
  • Flexible monitoring: Create charts that focus on specific status codes, ASN regions, or security actions that matter to your business.
  • Expanded limits: Log Explorer customers can create up to 100 dashboards (up from 25 for standard customers).
Custom Dashboards home page showing dashboard list and chart previews

To get started, refer to the Custom Dashboards documentation.

Logpush subrequest merging for HTTP requests

When a Cloudflare Worker intercepts a visitor request, it can dispatch additional outbound fetch calls called subrequests. By default, each subrequest generates its own log entry in Logpush, resulting in multiple log lines per visitor request. With subrequest merging enabled, subrequest data is embedded as a nested array field on the parent log record instead.

What's new

  • New subrequest_merging field on Logpush jobs — Set "merge_subrequests": true when creating or updating an http_requests Logpush job to enable the feature.
  • New Subrequests log field — When subrequest merging is enabled, a Subrequests field (array\<object\>) is added to each parent request log record. Each element in the array contains the standard http_requests fields for that subrequest.

Limitations

  • Applies to the http_requests (zone-scoped) dataset only.
  • A maximum of 50 subrequests are merged per parent request. Subrequests beyond this limit are passed through unmodified as individual log entries.
  • Subrequests must complete within 5 minutes of the visitor request. Subrequests that exceed this window are passed through unmodified.
  • Subrequests that do not qualify appear as separate log entries — no data is lost.
  • Subrequest merging is being gradually rolled out and is not yet available on all zones. Contact your account team for concerns or to ensure it is enabled for your zone.
  • For more information, refer to Subrequests.

Cloudflare Pipelines as a Logpush destination

Logpush has traditionally been great at delivering Cloudflare logs to a variety of destinations in JSON format. While JSON is flexible and easily readable, it can be inefficient to store and query at scale.

With this release, you can now send your logs directly to Pipelines to ingest, transform, and store your logs in R2 as Parquet files or Apache Iceberg tables managed by R2 Data Catalog. This makes the data footprint more compact and more efficient at querying your logs instantly with R2 SQL or any other query engine that supports Apache Iceberg or Parquet.

Transform logs before storage

Pipelines SQL runs on each log record in-flight, so you can reshape your data before it is written. For example, you can drop noisy fields, redact sensitive values, or derive new columns:

INSERT INTO http_logs_sink
SELECT
  ClientIP,
  EdgeResponseStatus,
  to_timestamp_micros(EdgeStartTimestamp) AS event_time,
  upper(ClientRequestMethod) AS method,
  sha256(ClientIP) AS hashed_ip
FROM http_logs_stream
WHERE EdgeResponseStatus >= 400;

Pipelines SQL supports string functions, regex, hashing, JSON extraction, timestamp conversion, conditional expressions, and more. For the full list, refer to the Pipelines SQL reference.

Get started

To configure Pipelines as a Logpush destination, refer to Enable Cloudflare Pipelines.

AI Insights updates on Cloudflare Radar

Radar adds three new features to the AI Insights page, expanding visibility into how AI bots, crawlers, and agents interact with the web.

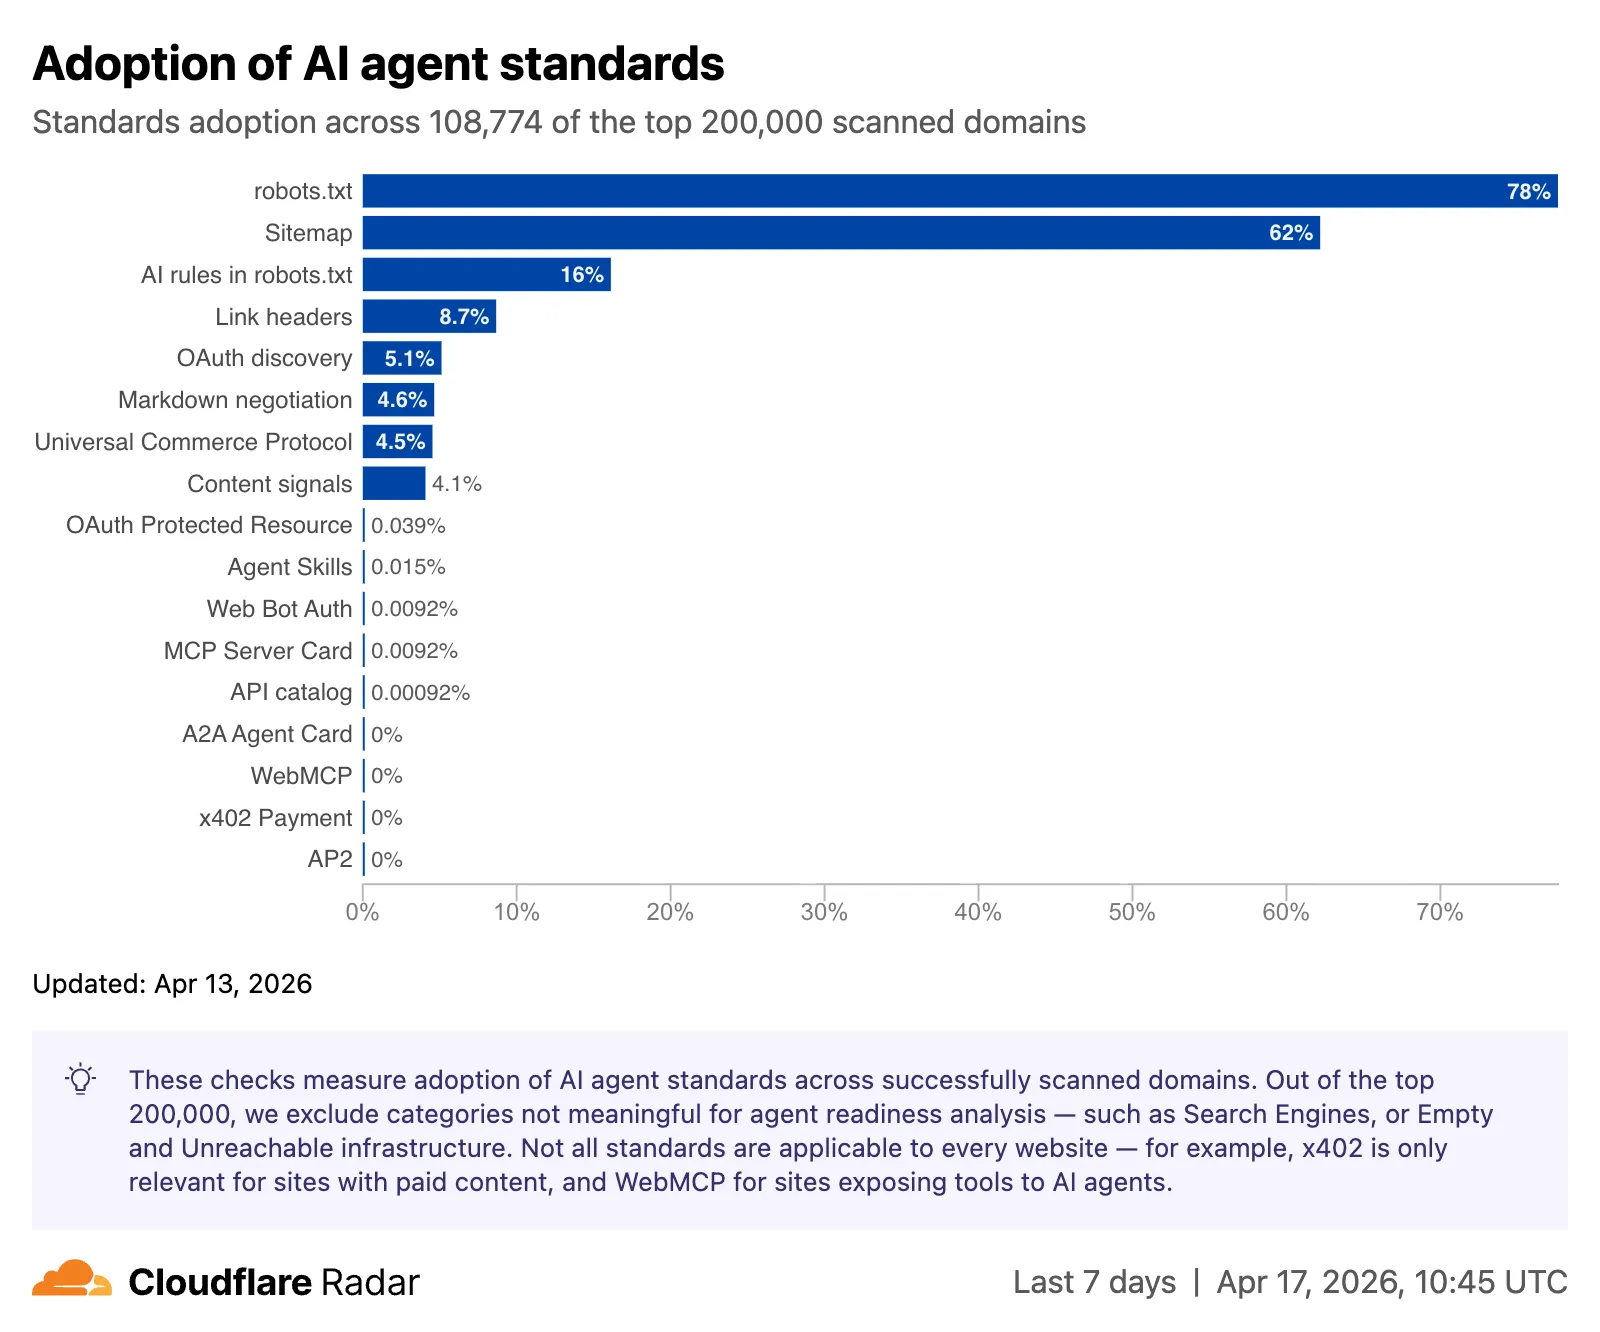
Adoption of AI agent standards

The AI Insights page now includes an adoption of AI agent standards widget that tracks how websites adopt agent-facing standards. The data is filterable by domain category and updated weekly on Mondays. This data is also available through the Agent Readiness API reference.

Screenshot of the adoption of AI agent standards chart

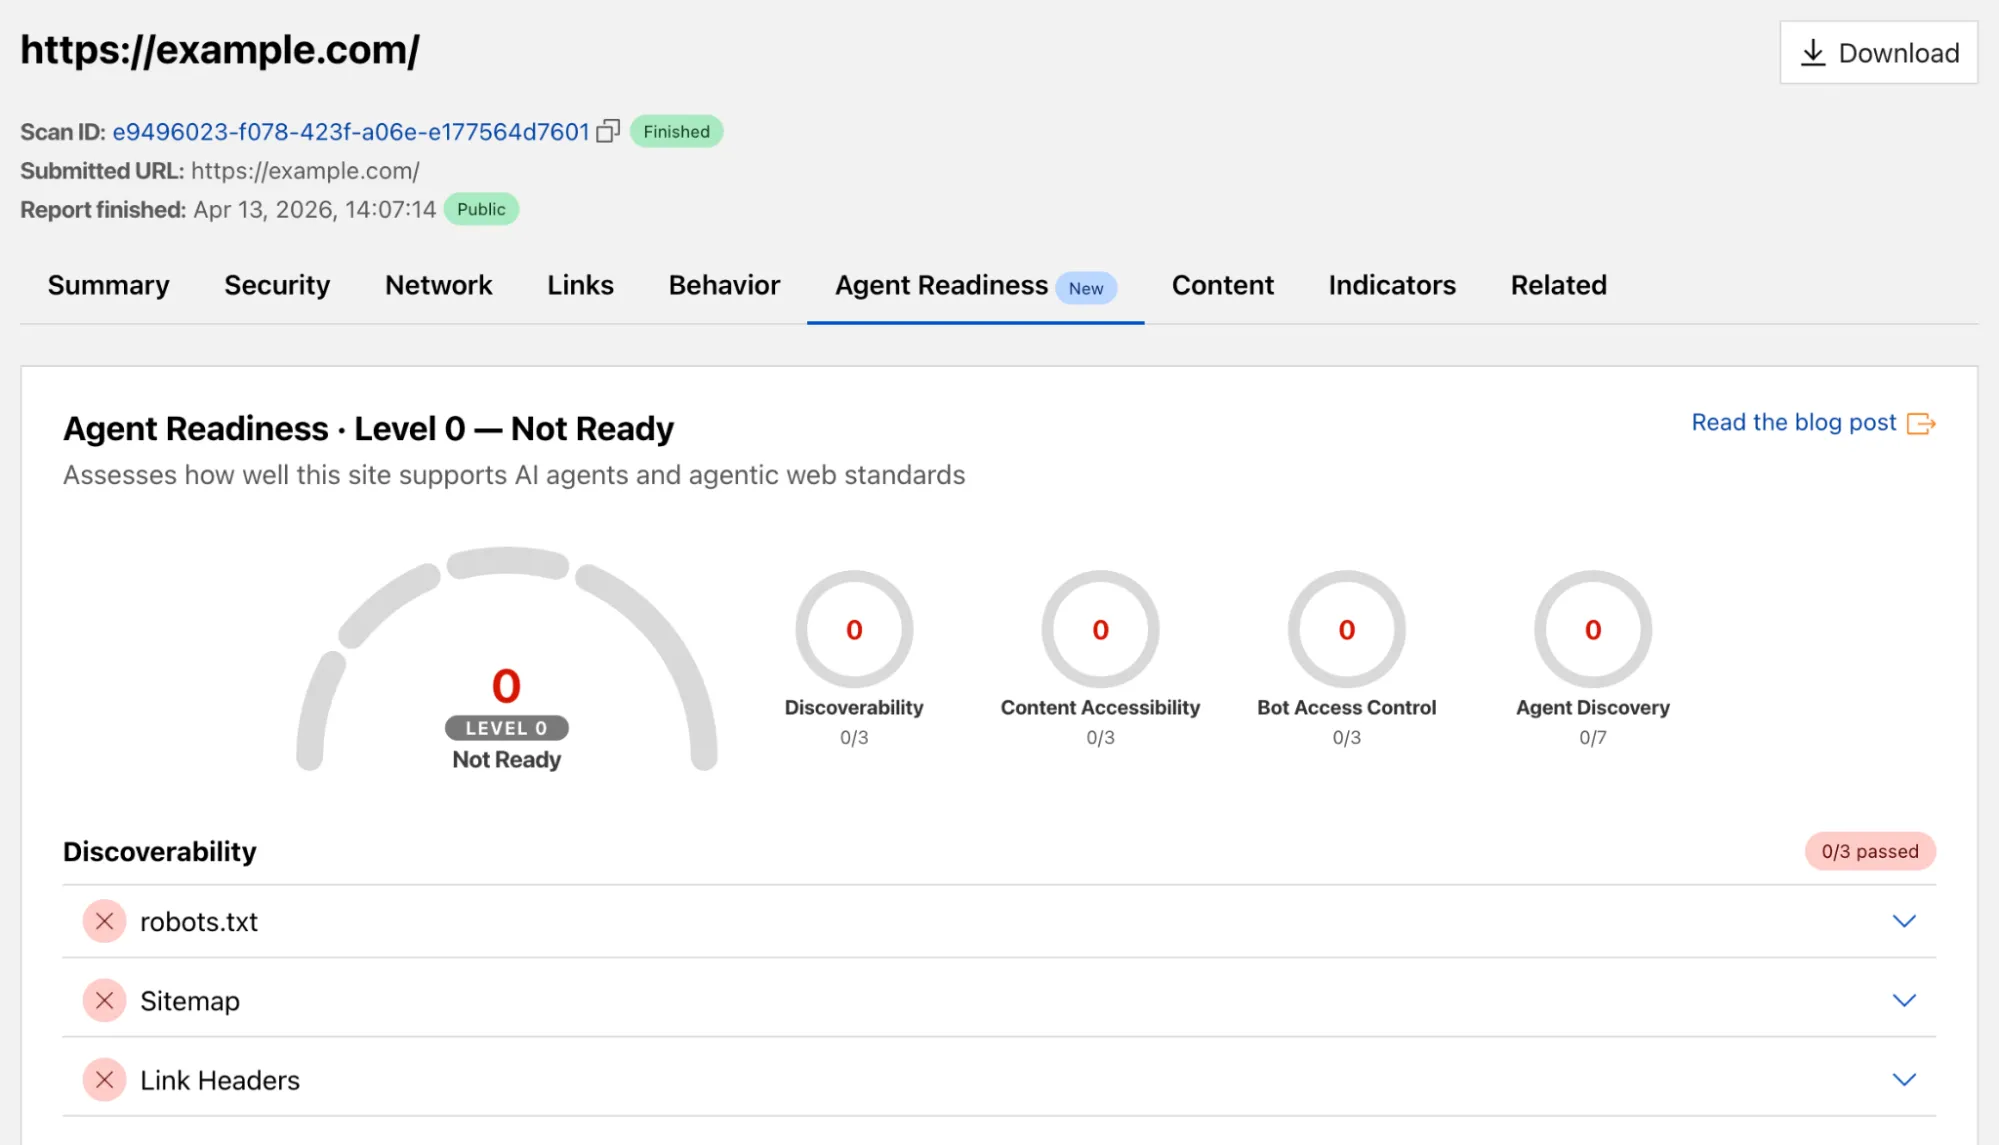
URL Scanner reports now include an Agent readiness tab that evaluates a scanned URL against the criteria used by the Agent Readiness score tool.

Screenshot of the URL Scanner agent readiness tab

For more details, refer to the Agent Readiness blog post.

Markdown for Agents savings

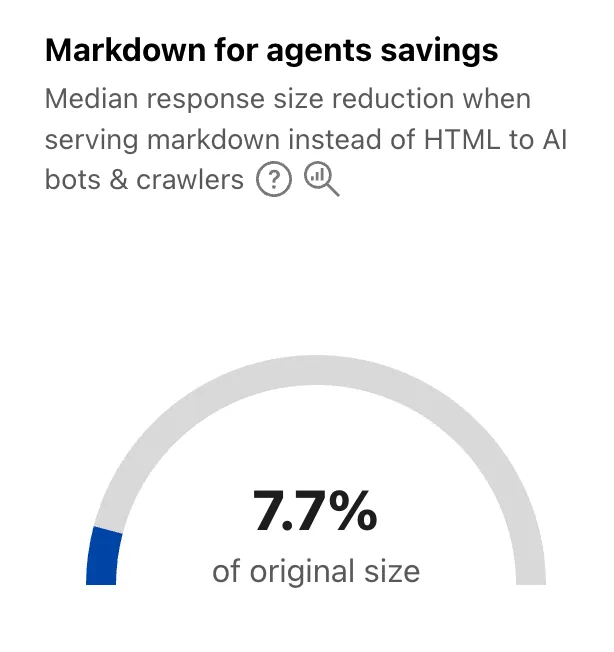
A new savings gauge shows the median response-size reduction when serving Markdown instead of HTML to AI bots and crawlers. This highlights the bandwidth and token savings that Markdown for Agents provides.

Screenshot of the Markdown for Agents savings gauge

For more details, refer to the Markdown for Agents API reference.

Response status

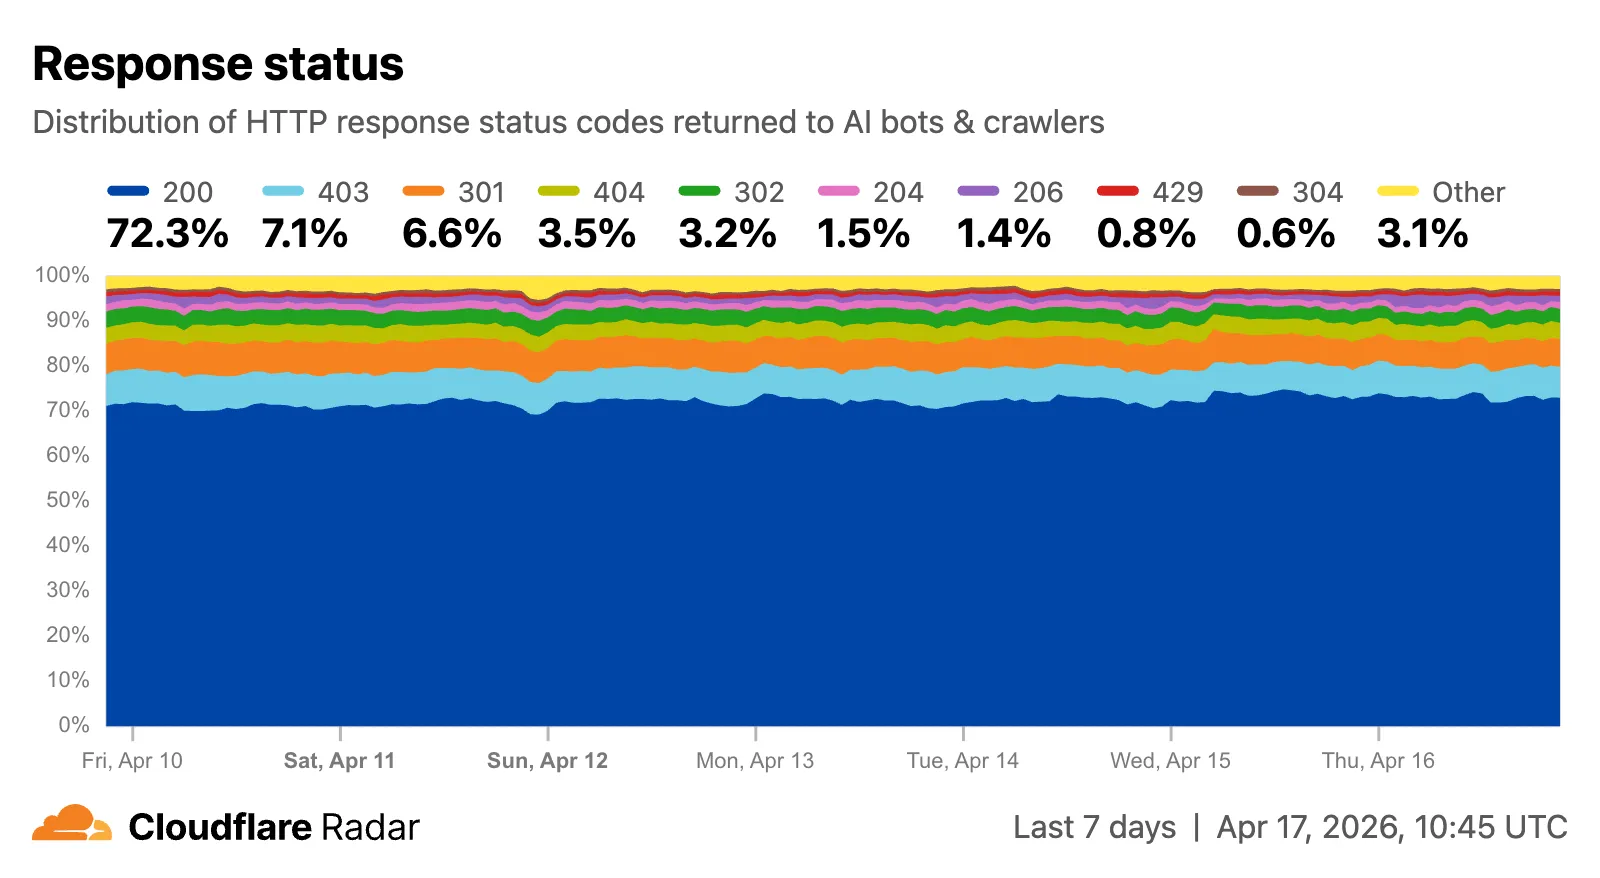
The new response status widget displays the distribution of HTTP response status codes returned to AI bots and crawlers. Results are groupable by individual status code (200, 403, 404) or by category (2xx, 3xx, 4xx, 5xx).

The same widget is available on each verified bot's detail page (only available for AI bots), for example Google.

Screenshot of the response status distribution widget

Explore all three features on the Cloudflare Radar AI Insights page.

New TenantID and Firewall for AI fields in Logpush datasets

Cloudflare has added new fields to multiple Logpush datasets:

TenantID field

The following Gateway and Zero Trust datasets now include a TenantID field:

Firewall for AI fields

The following datasets now include Firewall for AI fields:

  • Firewall Events:

    • FirewallForAIInjectionScore: The score indicating the likelihood of a prompt injection attack in the request.
    • FirewallForAIPIICategories: List of PII categories detected in the request.
    • FirewallForAITokenCount: The number of tokens in the request.
    • FirewallForAIUnsafeTopicCategories: List of unsafe topic categories detected in the request.
  • HTTP Requests:

    • FirewallForAIInjectionScore: The score indicating the likelihood of a prompt injection attack in the request.
    • FirewallForAIPIICategories: List of PII categories detected in the request.
    • FirewallForAITokenCount: The number of tokens in the request.
    • FirewallForAIUnsafeTopicCategories: List of unsafe topic categories detected in the request.

For the complete field definitions for each dataset, refer to Logpush datasets.

Logpush to BigQuery — Cloudflare dashboard support

You can now configure Logpush jobs to Google BigQuery directly from the Cloudflare dashboard, in addition to the existing API-based setup.

Previously, setting up a BigQuery Logpush destination required using the Logpush API. Now you can create and manage BigQuery Logpush jobs from the Logpush page in the Cloudflare dashboard by selecting Google BigQuery as the destination and entering your Google Cloud project ID, dataset ID, table ID, and service account credentials.

For more information, refer to Enable Logpush to Google BigQuery.

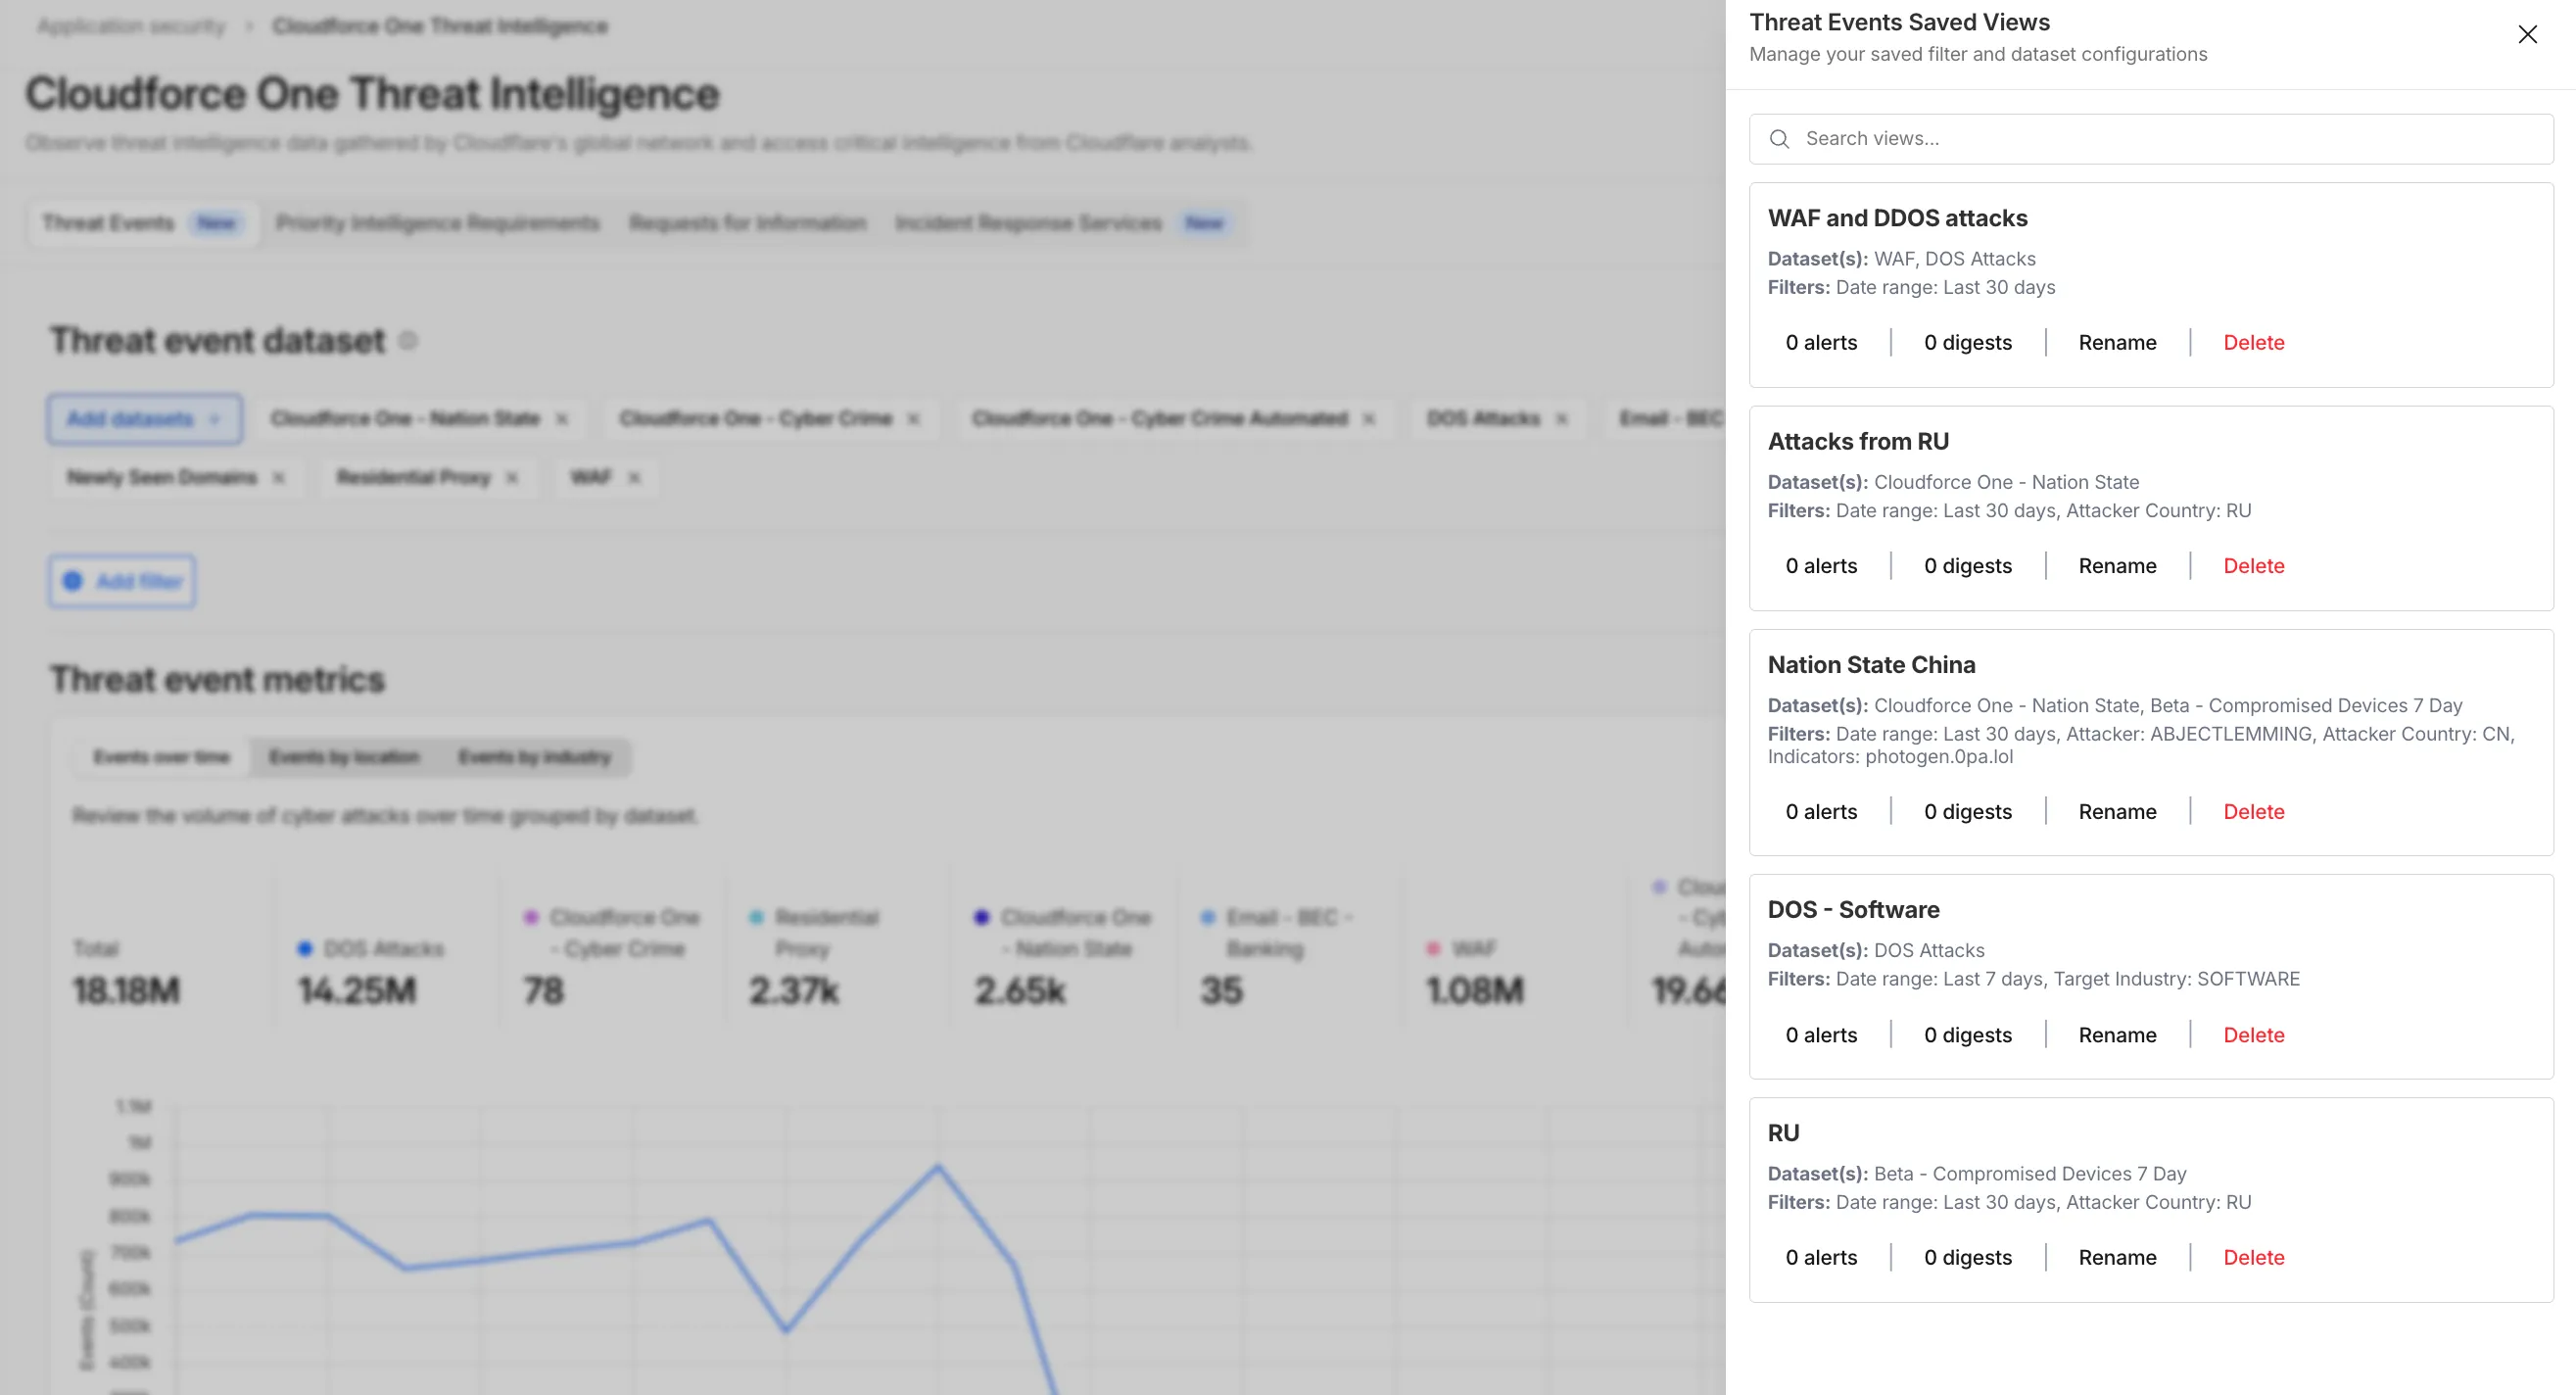
Real-time alerts and daily digests for Threat Events

You can now automate your threat monitoring by setting up custom alerts in your saved views. Instead of manually checking the dashboard for updates, you can subscribe to notifications that trigger whenever new data matches your specific filter sets, like new activity associated to a particular threat actor or spikes in activity within your industry.

Stay ahead of emerging threats

By linking your saved views to the Cloudflare Notifications Center, you can ensure the right information reaches your team at the right time.

  • Immediate Alerts: receive real-time notifications the moment a critical event is detected that matches your saved criteria. This is essential for high-priority monitoring, such as tracking active campaigns from specific APT groups.

  • Daily Digests: opt for a summarized report delivered once a day. This is ideal for maintaining situational awareness of broader trends, like regional activity shifts or industry-wide threat landscapes, without cluttering your inbox.

Threat Events notifications

How to get started

To set up an alert, go to Application Security > Threat Intelligence > Threat Events. From there:

  1. Choose your datasets and apply your desired filters and select Save View (or select an existing one).
  2. Open the Manage Saved Views menu.
  3. Select Add Alert next to your chosen view to configure your notification preferences in the Cloudflare dashboard.

For more technical details on configuring notifications, refer to the Threat Events documentation.

Routing Section Expansion on Cloudflare Radar

Radar now features an expanded Routing section with dedicated sub-pages, providing a more organized and in-depth view of the global routing ecosystem. This restructuring lays the groundwork for additional routing features and widgets coming in the near future.

Dedicated sub-pages

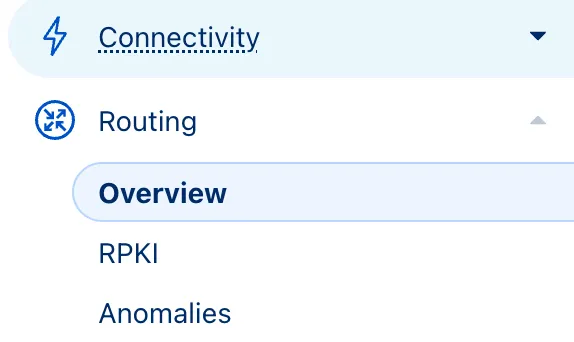
The single Routing page has been split into three focused sub-pages:

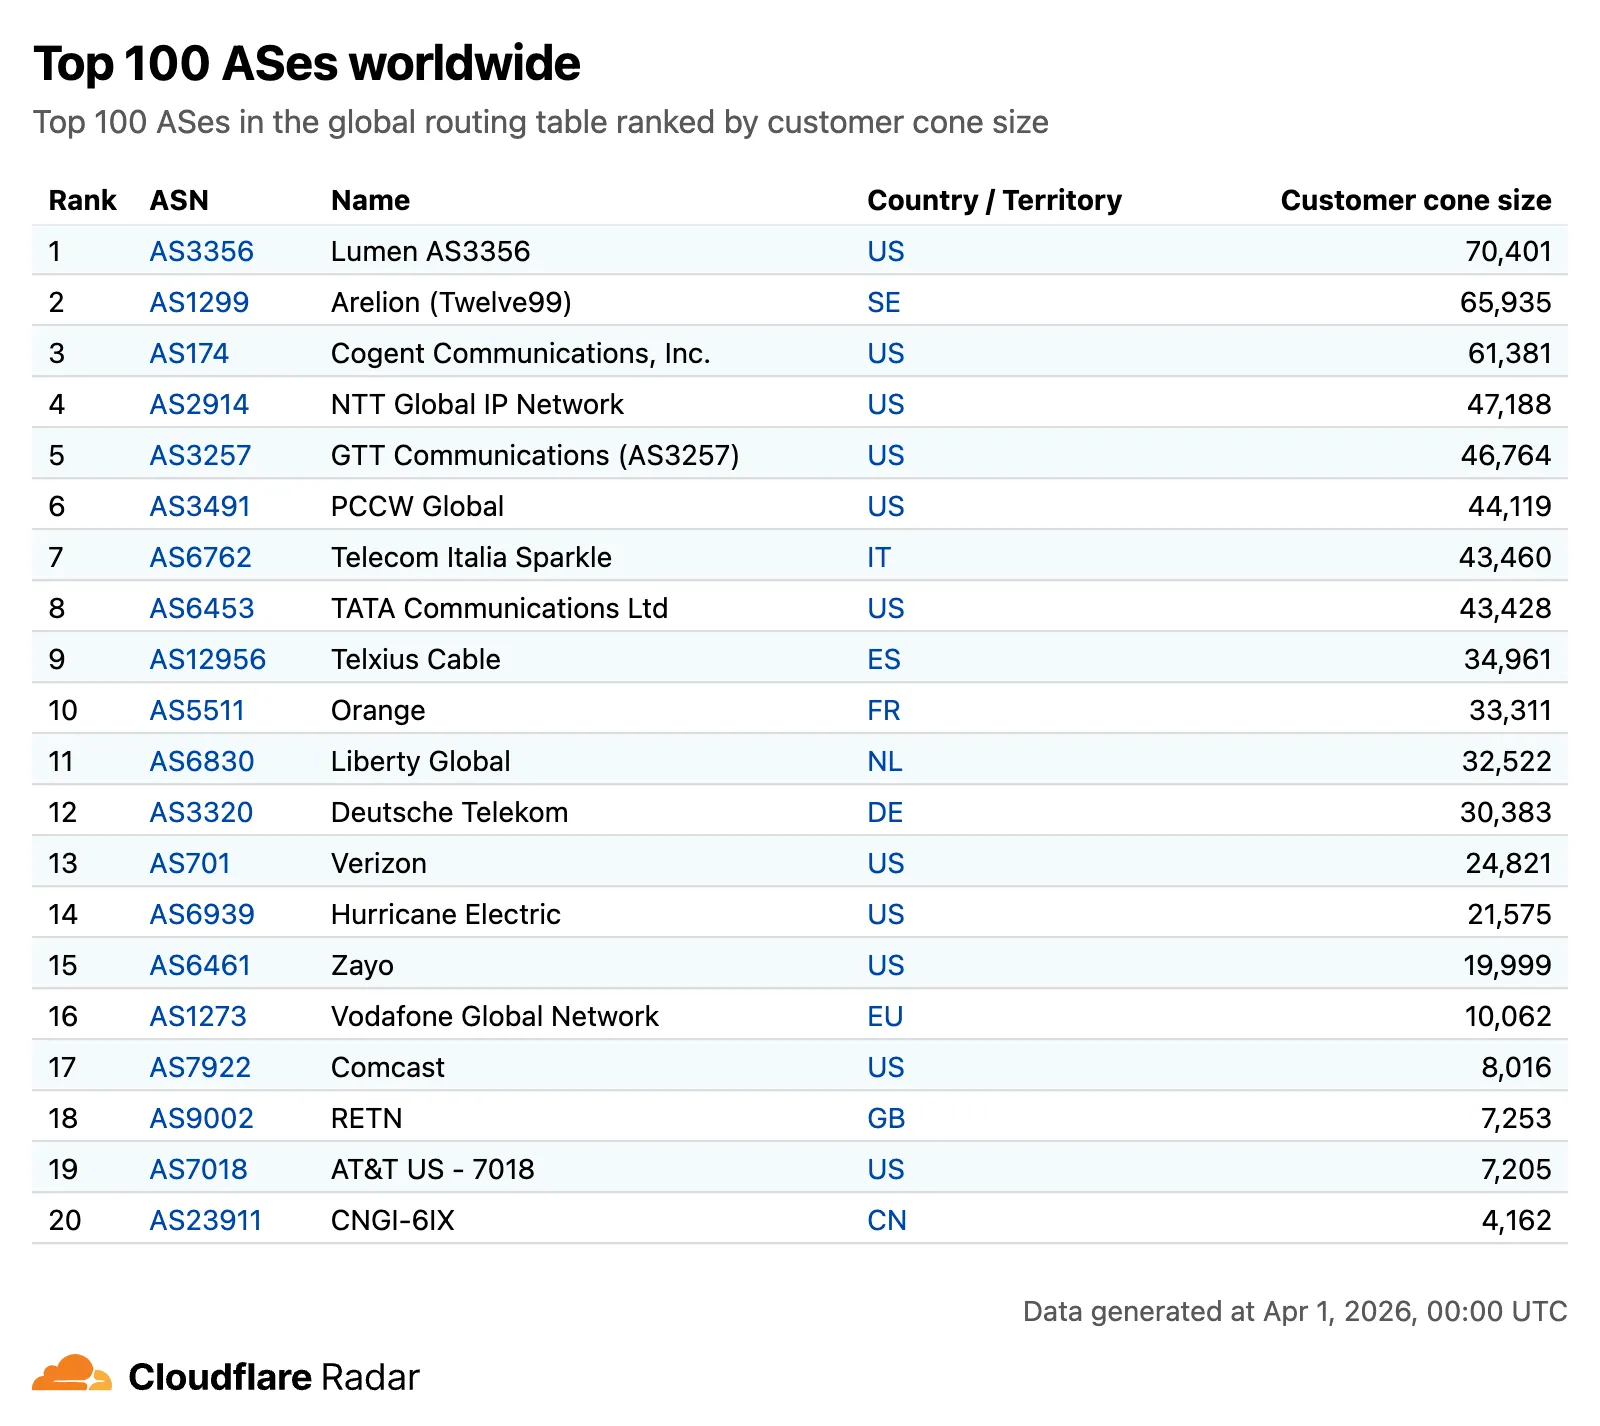
  • Overview — Routing statistics, IP address space trends, BGP announcements, and the new Top 100 ASes ranking.
  • RPKI — RPKI validation status, ASPA deployment trends, and per-ASN ASPA provider details.
  • Anomalies — BGP route leaks, origin hijacks, and Multi-Origin AS (MOAS) conflicts.
Screenshot of the routing section menu

New widgets

The routing overview now includes a Top 100 ASes table ranking autonomous systems by customer cone size, IPv4 address space, or IPv6 address space. Users can switch between rankings using a segmented control.

Screenshot of the top-100 ASes table

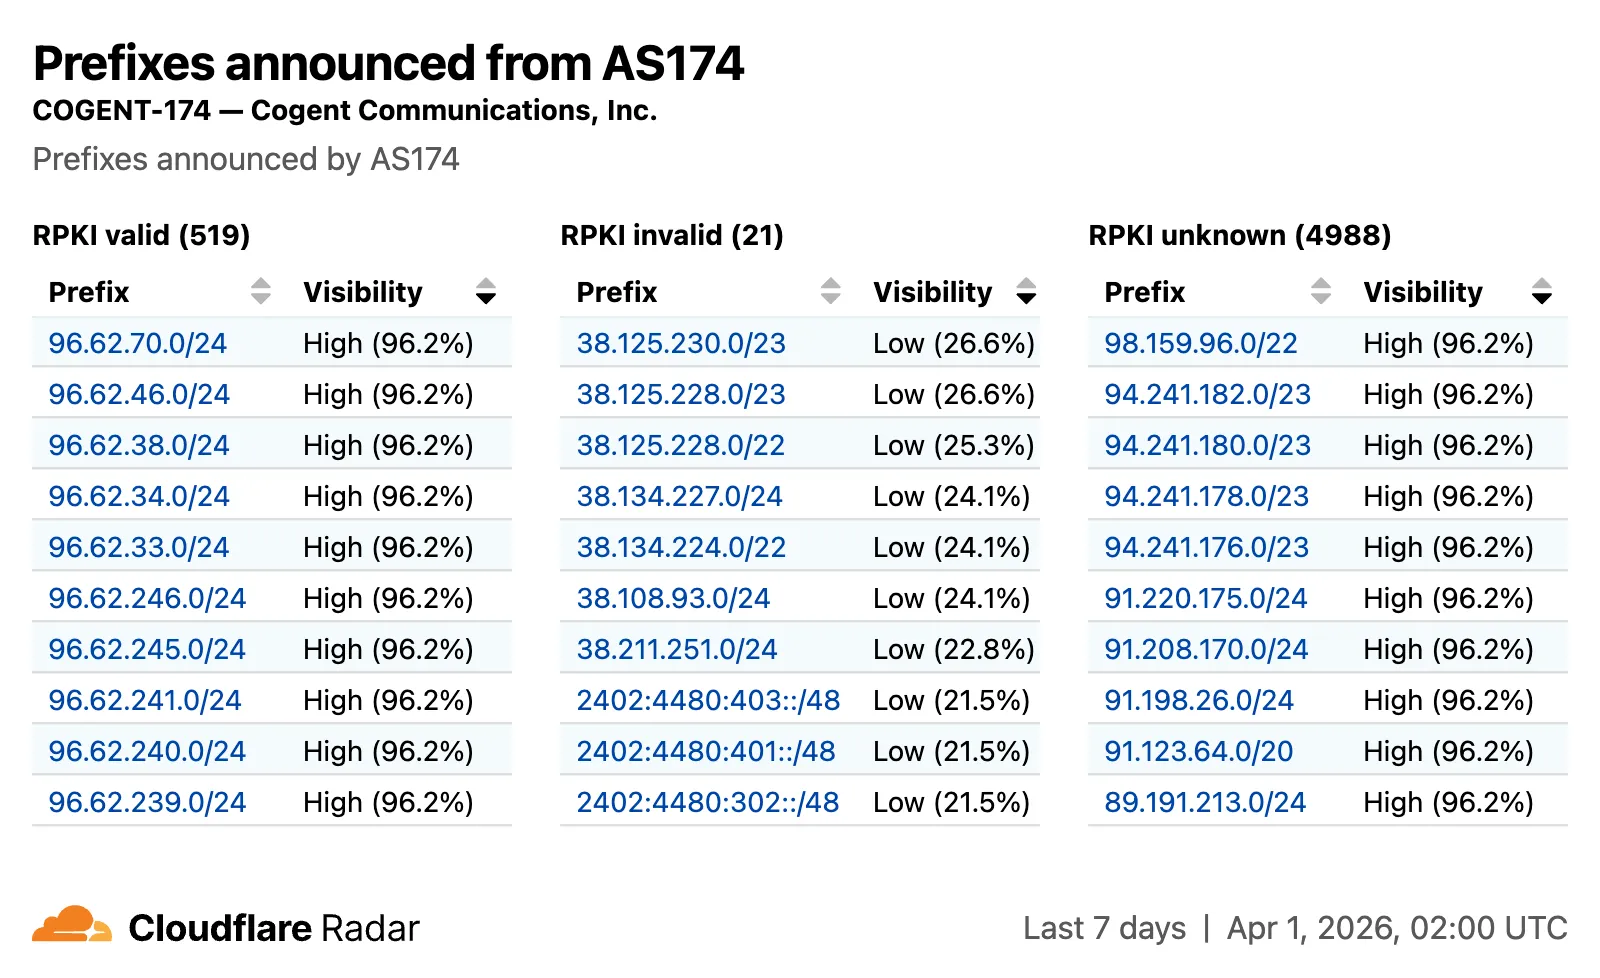
The RPKI sub-page introduces a RPKI validation view for per-ASN pages, showing prefixes grouped by RPKI validation status (Valid, Invalid, Unknown) with visibility scores.

Screenshot of the RPKI validation view

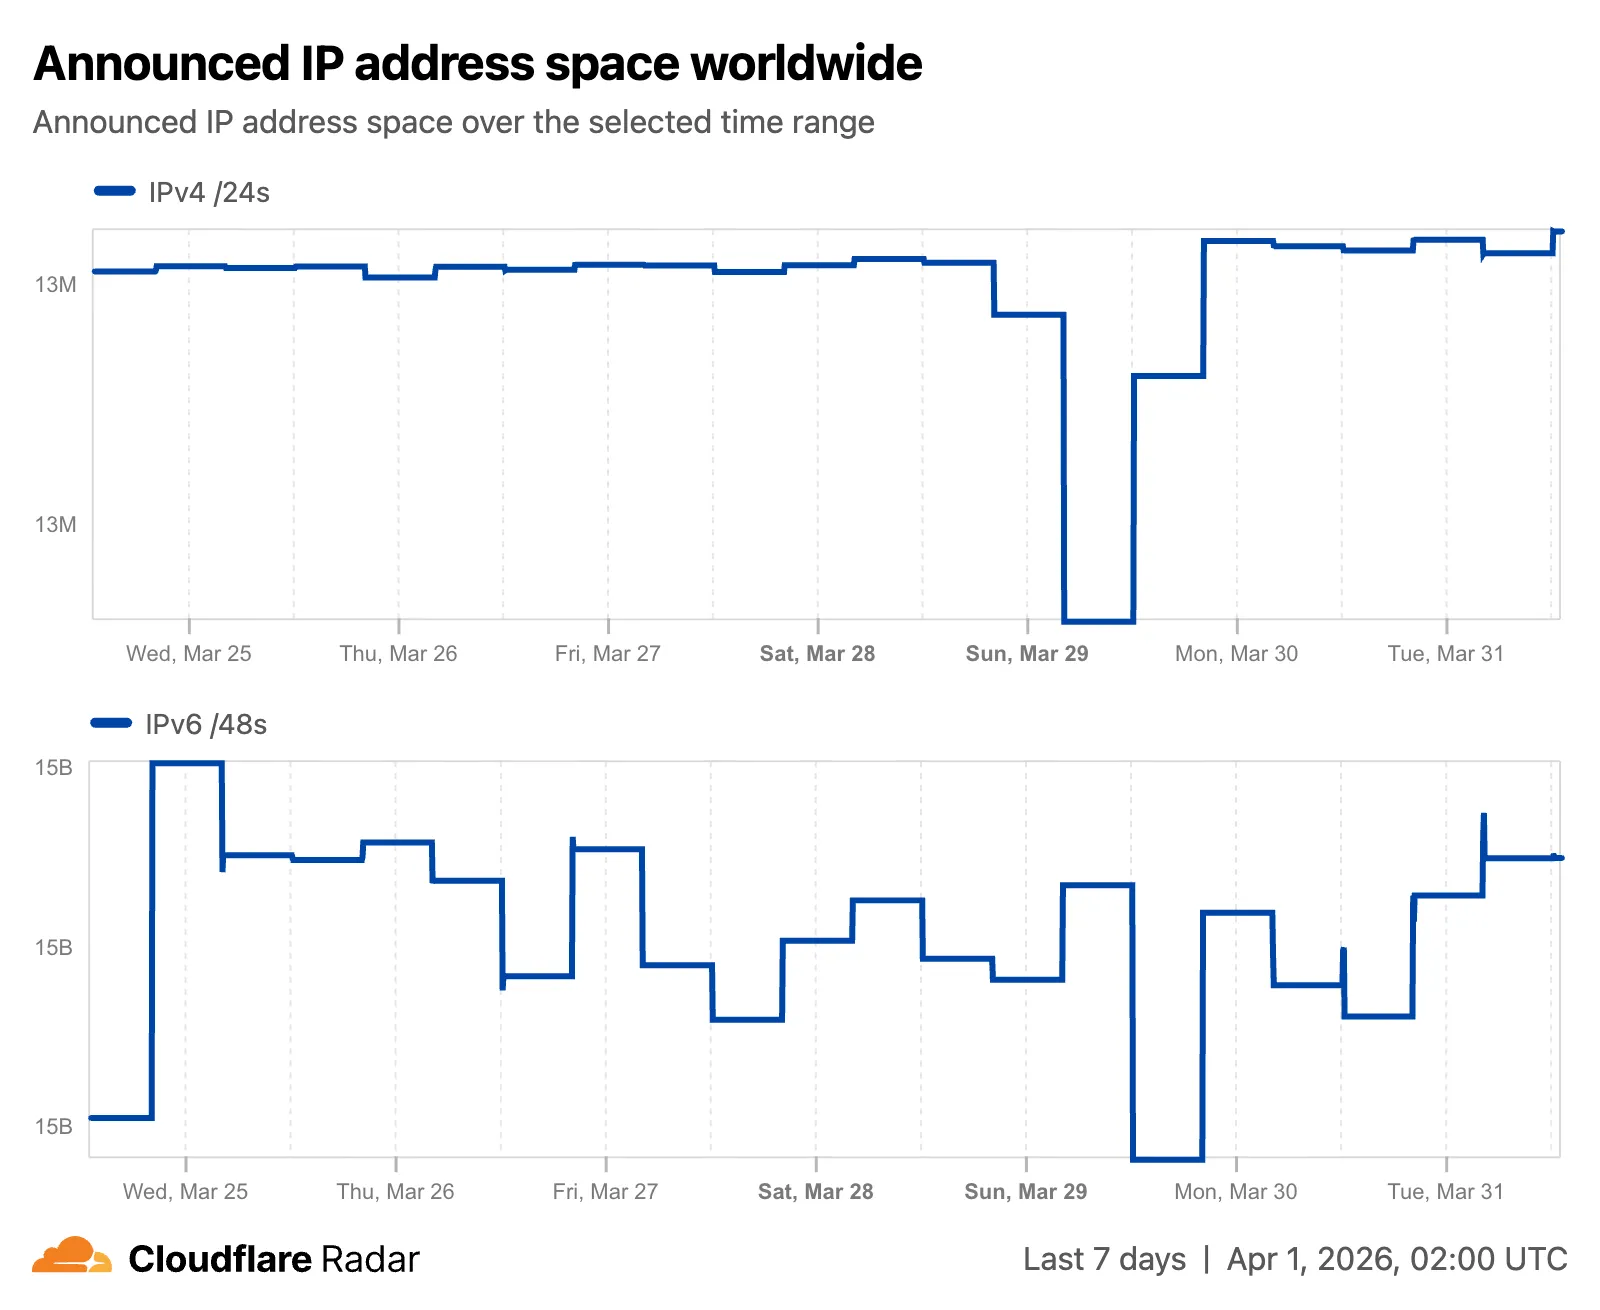
Improved IP address space chart

The IP address space chart now displays both IPv4 and IPv6 trends stacked vertically and is available on global, country, and AS views.

Screenshot of the IPv4 and IPv6 combined IP space chart

Check out the Radar routing section to explore the data, and stay tuned for more routing insights coming soon.

URL Scanner improvements on Cloudflare Radar

Radar ships several improvements to the URL Scanner that make scan reports more informative and easier to share:

  • Live screenshots — the summary card now includes an option to capture a live screenshot of the scanned URL on demand using the Browser Rendering API.
  • Save as PDF — a new button generates a print-optimized document aggregating all tab contents (Summary, Security, Network, Behavior, and Indicators) into a single file.
  • Download as JSON — raw scan data is available as a JSON download for programmatic use.
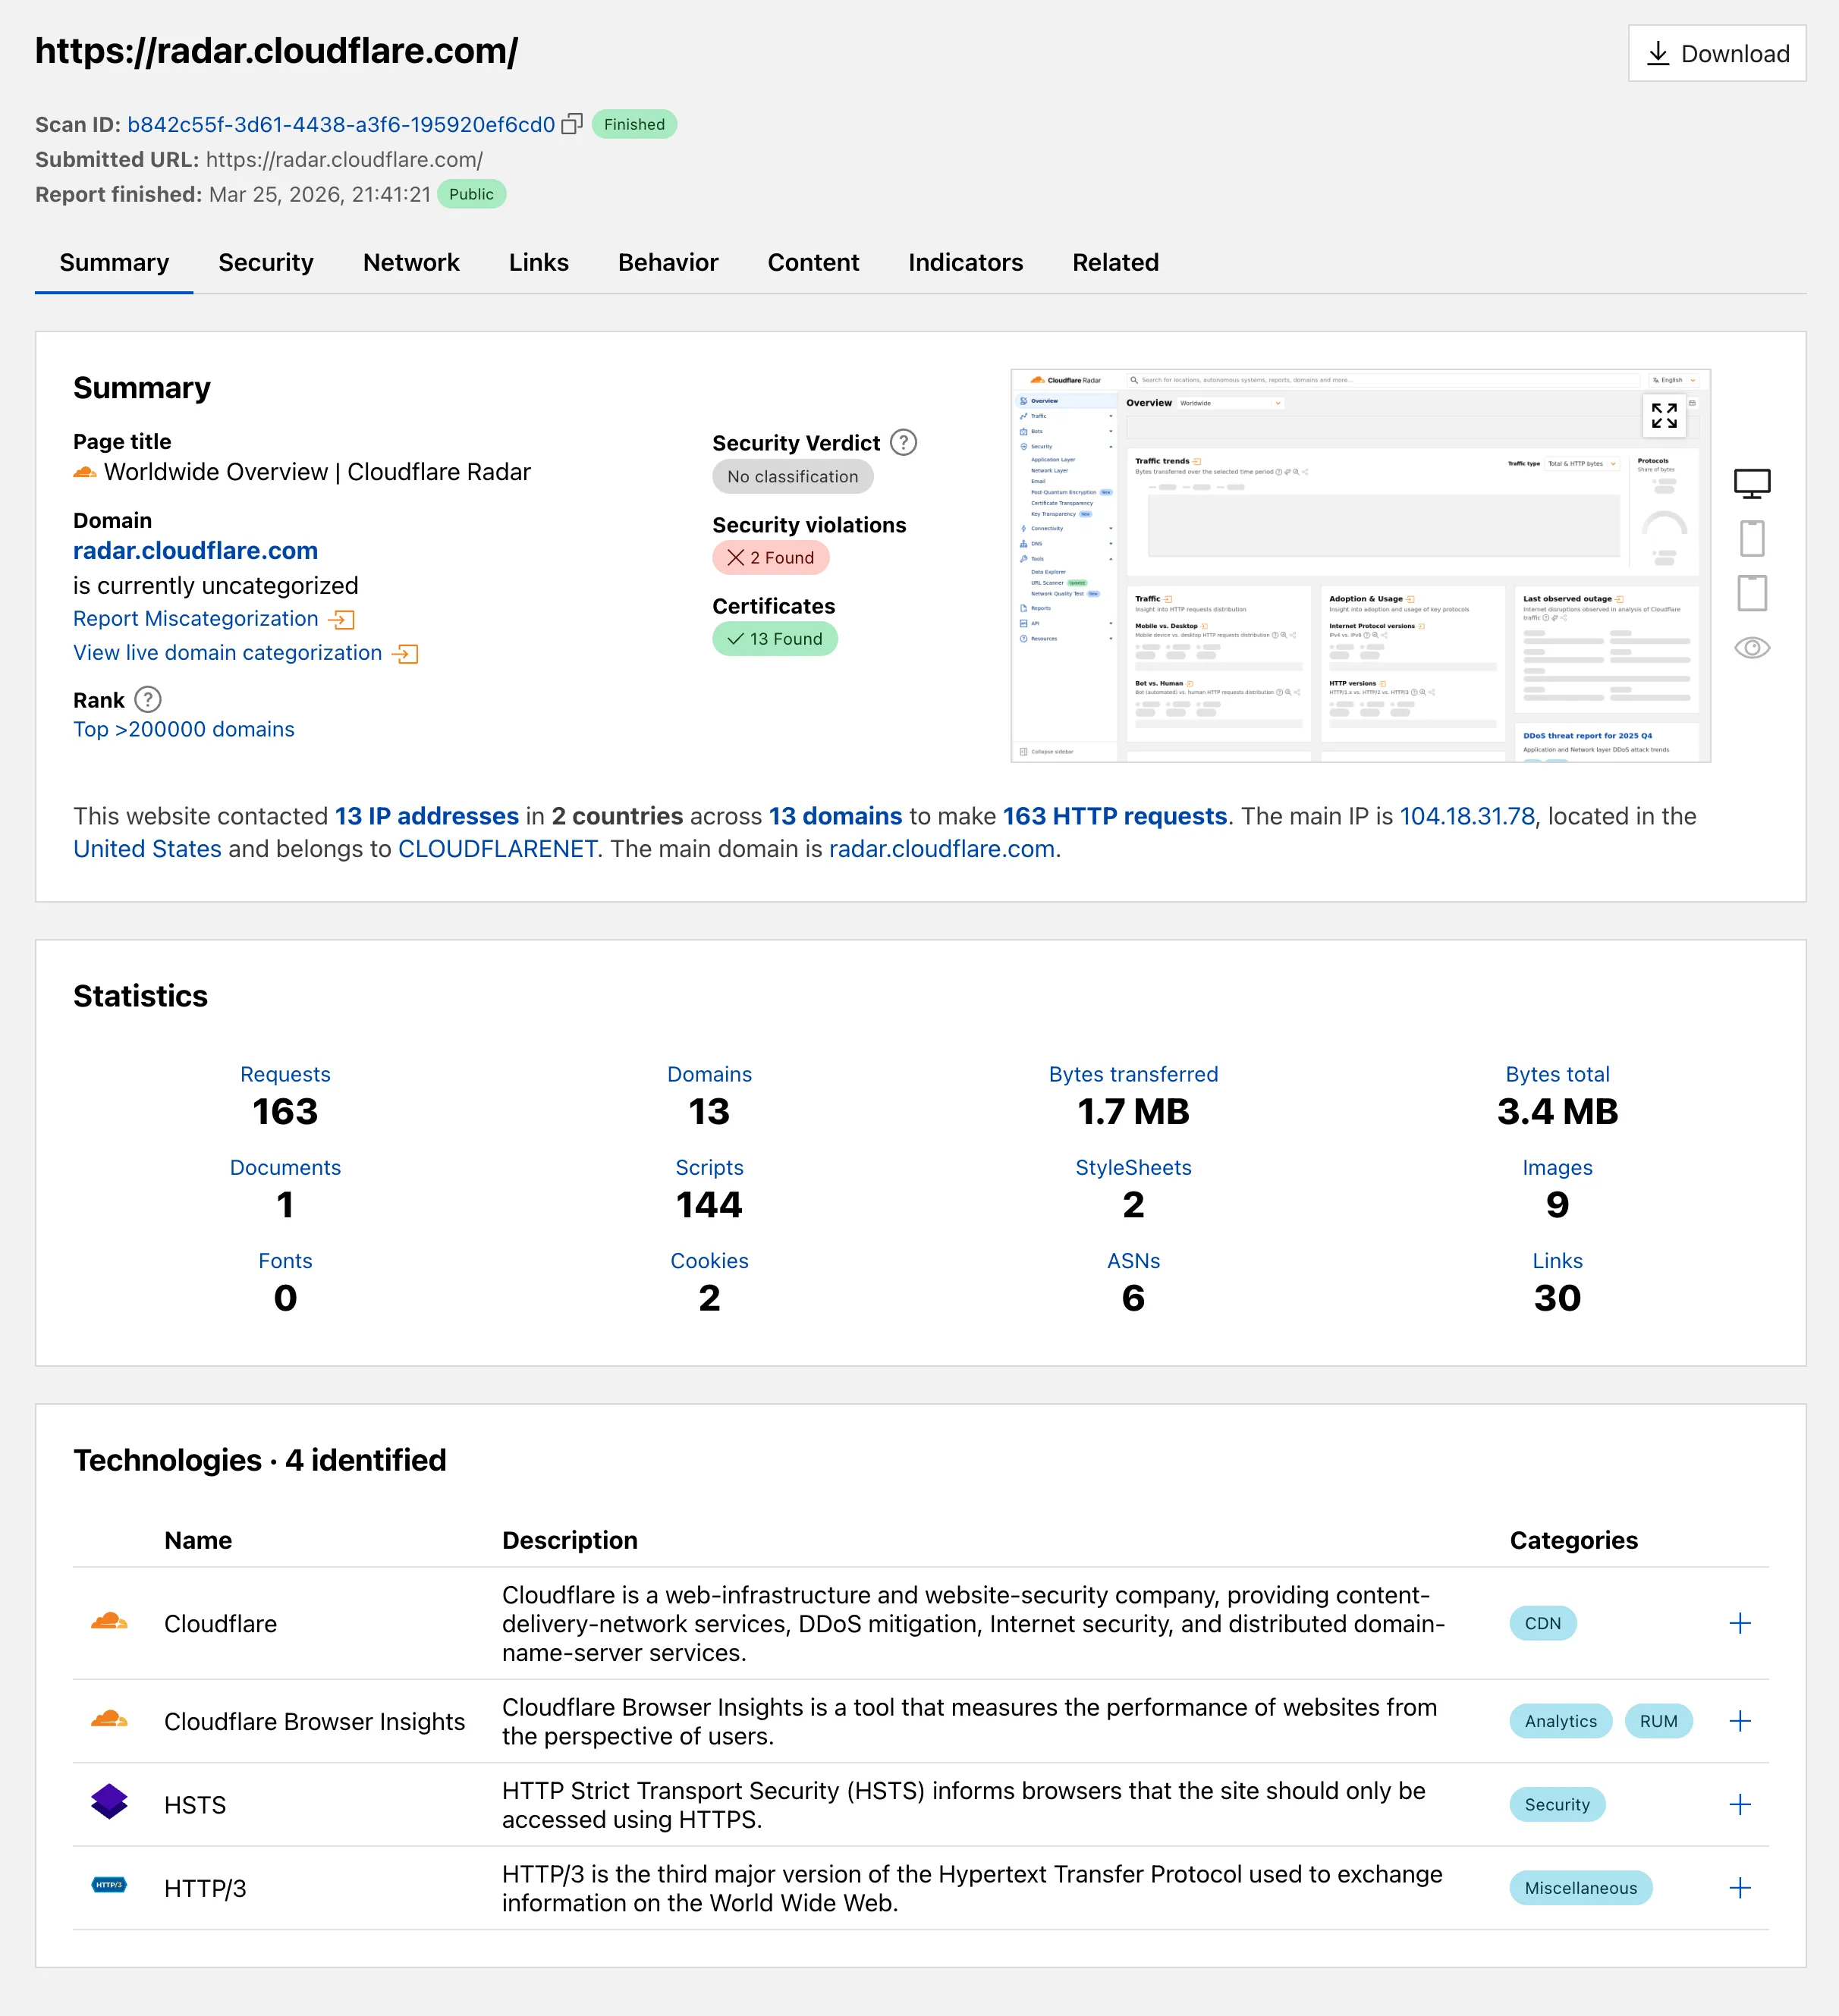
  • Redesigned summary layout — page information and security details are now displayed side by side with the screenshot, with a layout that adapts to narrower viewports.
  • File downloads — downloads are separated into a dedicated card with expandable rows showing each file's source URL and SHA256 hash.
  • Detailed IP address data — the Network tab now includes additional detail per IP address observed during the scan.
Screenshot of the redesigned URL Scanner summary on Radar

Explore these improvements on the Cloudflare Radar URL Scanner.

Logpush — More granular timestamps

Logpush now supports higher-precision timestamp formats for log output. You can configure jobs to output timestamps at millisecond or nanosecond precision. This is available in both the Logpush UI in the Cloudflare dashboard and the Logpush API.

To use the new formats, set timestamp_format in your Logpush job's output_options:

  • rfc3339ms2024-02-17T23:52:01.123Z
  • rfc3339ns2024-02-17T23:52:01.123456789Z

Default timestamp formats apply unless explicitly set. The dashboard defaults to rfc3339 and the API defaults to unixnano.

For more information, refer to the Log output options documentation.

Real-time logo match preview

We are introducing Logo Match Preview, bringing the same pre-save visibility to visual assets that was previously only available for string-based queries. This update allows you to fine-tune your brand detection strategy before committing to a live monitor.

What’s new:

  • Upload your brand logo and immediately see a sample of potential matches from recently detected sites before finalizing the query
  • Adjust your similarity score (from 75% to 100%) and watch the results refresh in real-time to find the balance between broad detection and noise reduction
  • Review the specific logos triggered by your current settings to ensure your query is capturing the right level of brand infringement

If you are ready to test your brand assets, go to the Brand Protection dashboard to try the new preview tool.

Ingest field selection for Log Explorer

Cloudflare Log Explorer now allows you to customize exactly which data fields are ingested and stored when enabling or managing log datasets.

Previously, ingesting logs often meant taking an "all or nothing" approach to data fields. With Ingest Field Selection, you can now choose from a list of available and recommended fields for each dataset. This allows you to reduce noise, focus on the metrics that matter most to your security and performance analysis, and manage your data footprint more effectively.

Key capabilities

  • Granular control: Select only the specific fields you need when enabling a new dataset.
  • Dynamic updates: Update fields for existing, already enabled logstreams at any time.
  • Historical consistency: Even if you disable a field later, you can still query and receive results for that field for the period it was captured.
  • Data integrity: Core fields, such as Timestamp, are automatically retained to ensure your logs remain searchable and chronologically accurate.

Example configuration

When configuring a dataset via the dashboard or API, you can define a specific set of fields. The Timestamp field remains mandatory to ensure data indexability.

{
  "dataset": "firewall_events",
  "enabled": true,
  "fields": [
    "Timestamp",
    "ClientRequestHost",
    "ClientIP",
    "Action",
    "EdgeResponseStatus",
    "OriginResponseStatus"
  ]
}

For more information, refer to the Log Explorer documentation.

New MCP Portal Logs dataset and new fields across multiple Logpush datasets in Cloudflare Logs

Cloudflare has added new fields across multiple Logpush datasets:

New dataset

  • MCP Portal Logs: A new dataset with fields including ClientCountry, ClientIP, ColoCode, Datetime, Error, Method, PortalAUD, PortalID, PromptGetName, ResourceReadURI, ServerAUD, ServerID, ServerResponseDurationMs, ServerURL, SessionID, Success, ToolCallName, UserEmail, and UserID.

New fields in existing datasets

  • DEX Application Tests: HTTPRedirectEndMs, HTTPRedirectStartMs, HTTPResponseBody, and HTTPResponseHeaders.
  • DEX Device State Events: ExperimentalExtra.
  • Firewall Events: FraudUserID.
  • Gateway HTTP: AppControlInfo and ApplicationStatuses.
  • Gateway DNS: InternalDNSDurationMs.
  • HTTP Requests: FraudEmailRisk, FraudUserID, and PayPerCrawlStatus.
  • Network Analytics Logs: DNSQueryName, DNSQueryType, and PFPCustomTag.
  • WARP Toggle Changes: UserEmail.
  • WARP Config Changes: UserEmail.
  • Zero Trust Network Session Logs: SNI.

For the complete field definitions for each dataset, refer to Logpush datasets.

Region Filtering, AS Traffic Volume, and Navigation Improvements on Cloudflare Radar

Radar ships several new features that improve the flexibility and usability of the platform, as well as visibility into what is happening on the Internet.

Region filtering

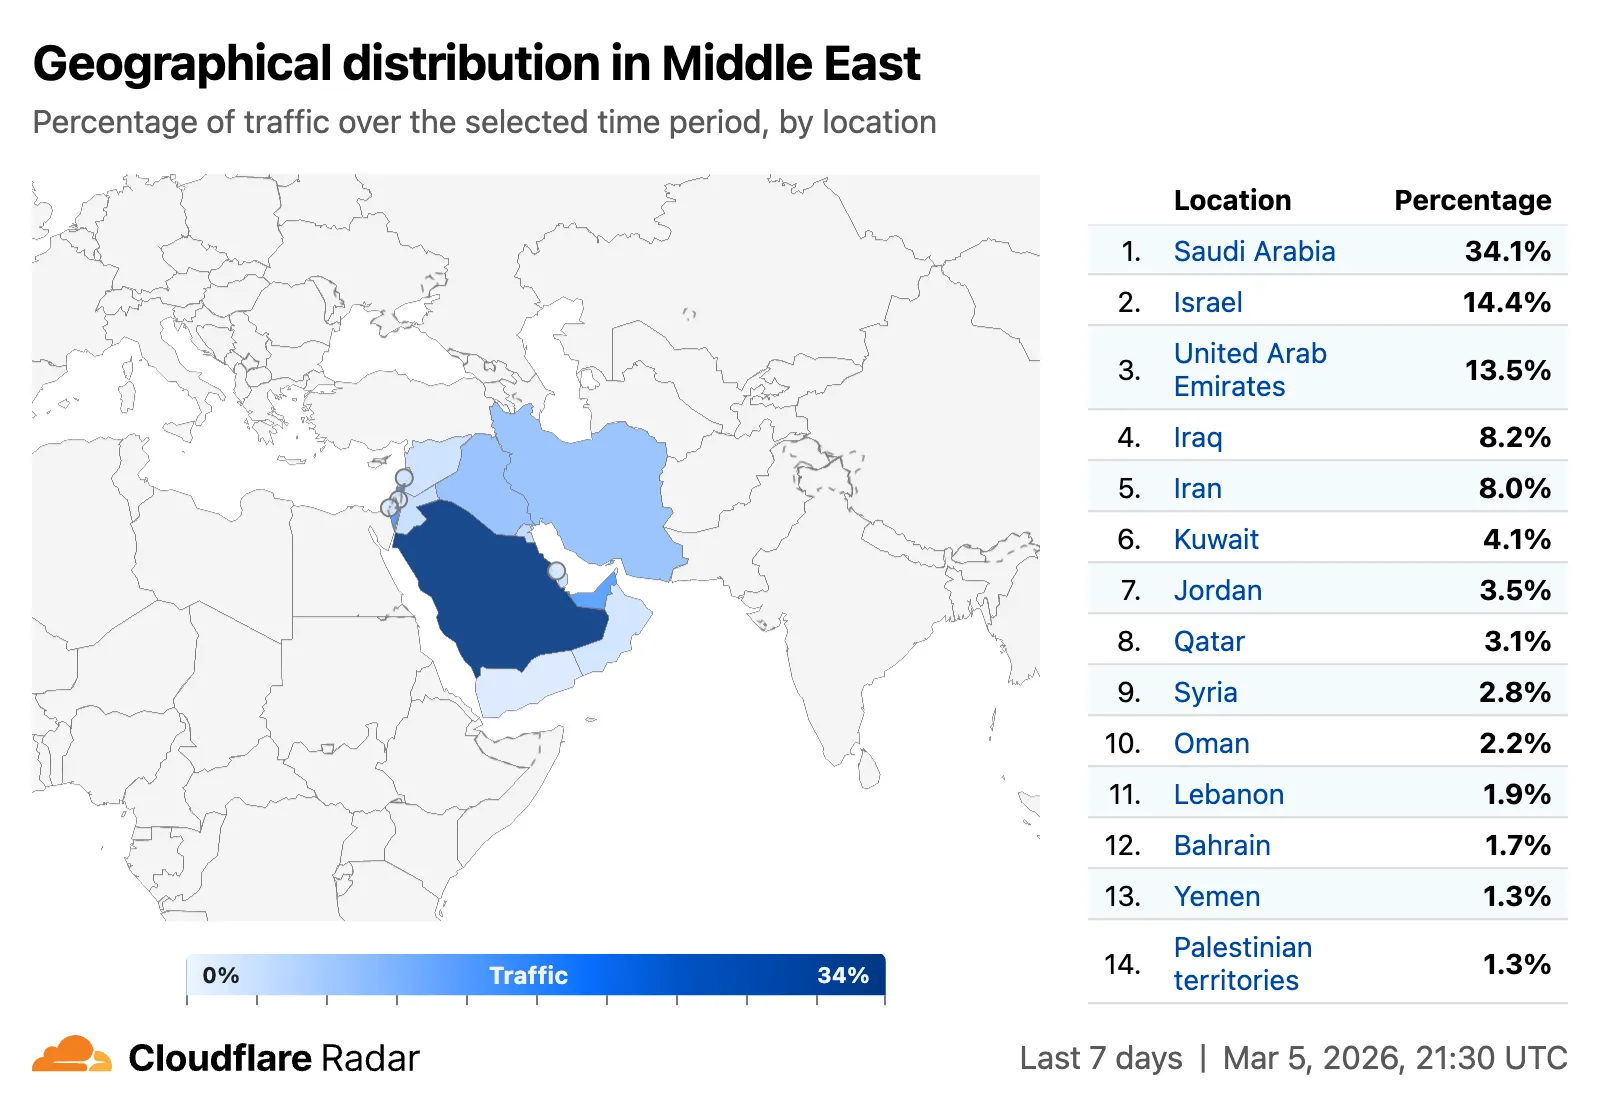
All location-aware pages now support filtering by region, including continents, geographic subregions (Middle East, Eastern Asia, etc.), political regions (EU, African Union), and US Census regions/divisions (for example, New England, US Northeast).

Screenshot of region filtering on Radar - Middle east

Traffic volume by top autonomous systems and locations

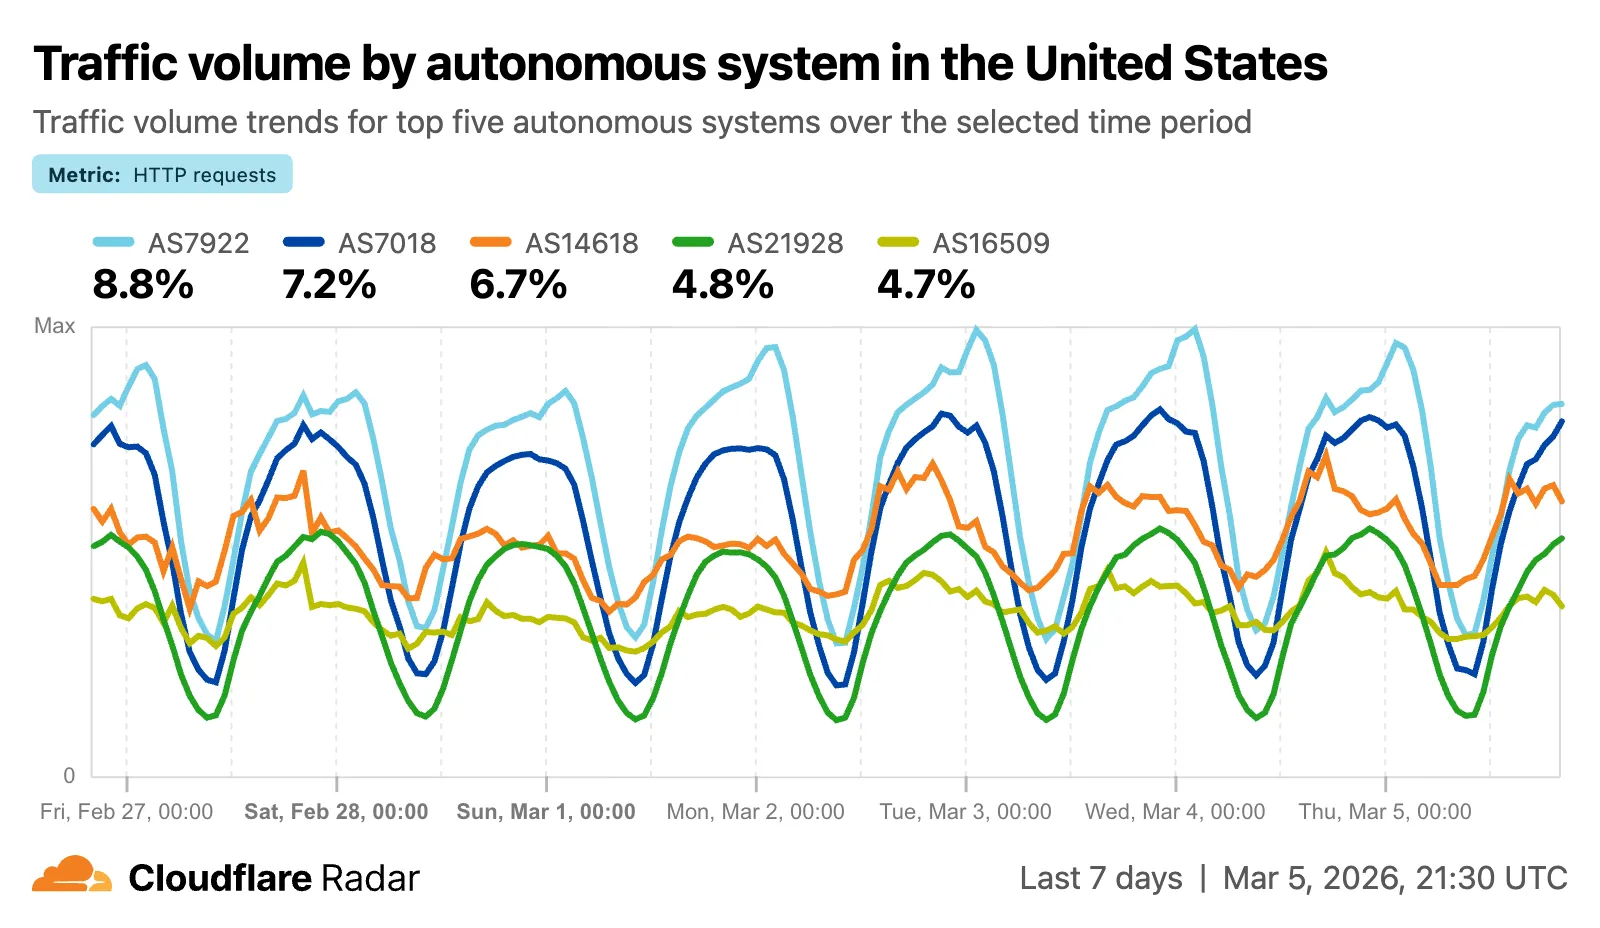
A new traffic volume view shows the top autonomous systems and countries/territories for a given location. This is useful for quickly determining which network providers in a location may be experiencing connectivity issues, or how traffic is distributed across a region.

Screenshot of traffic volume by top autonomous systems in US

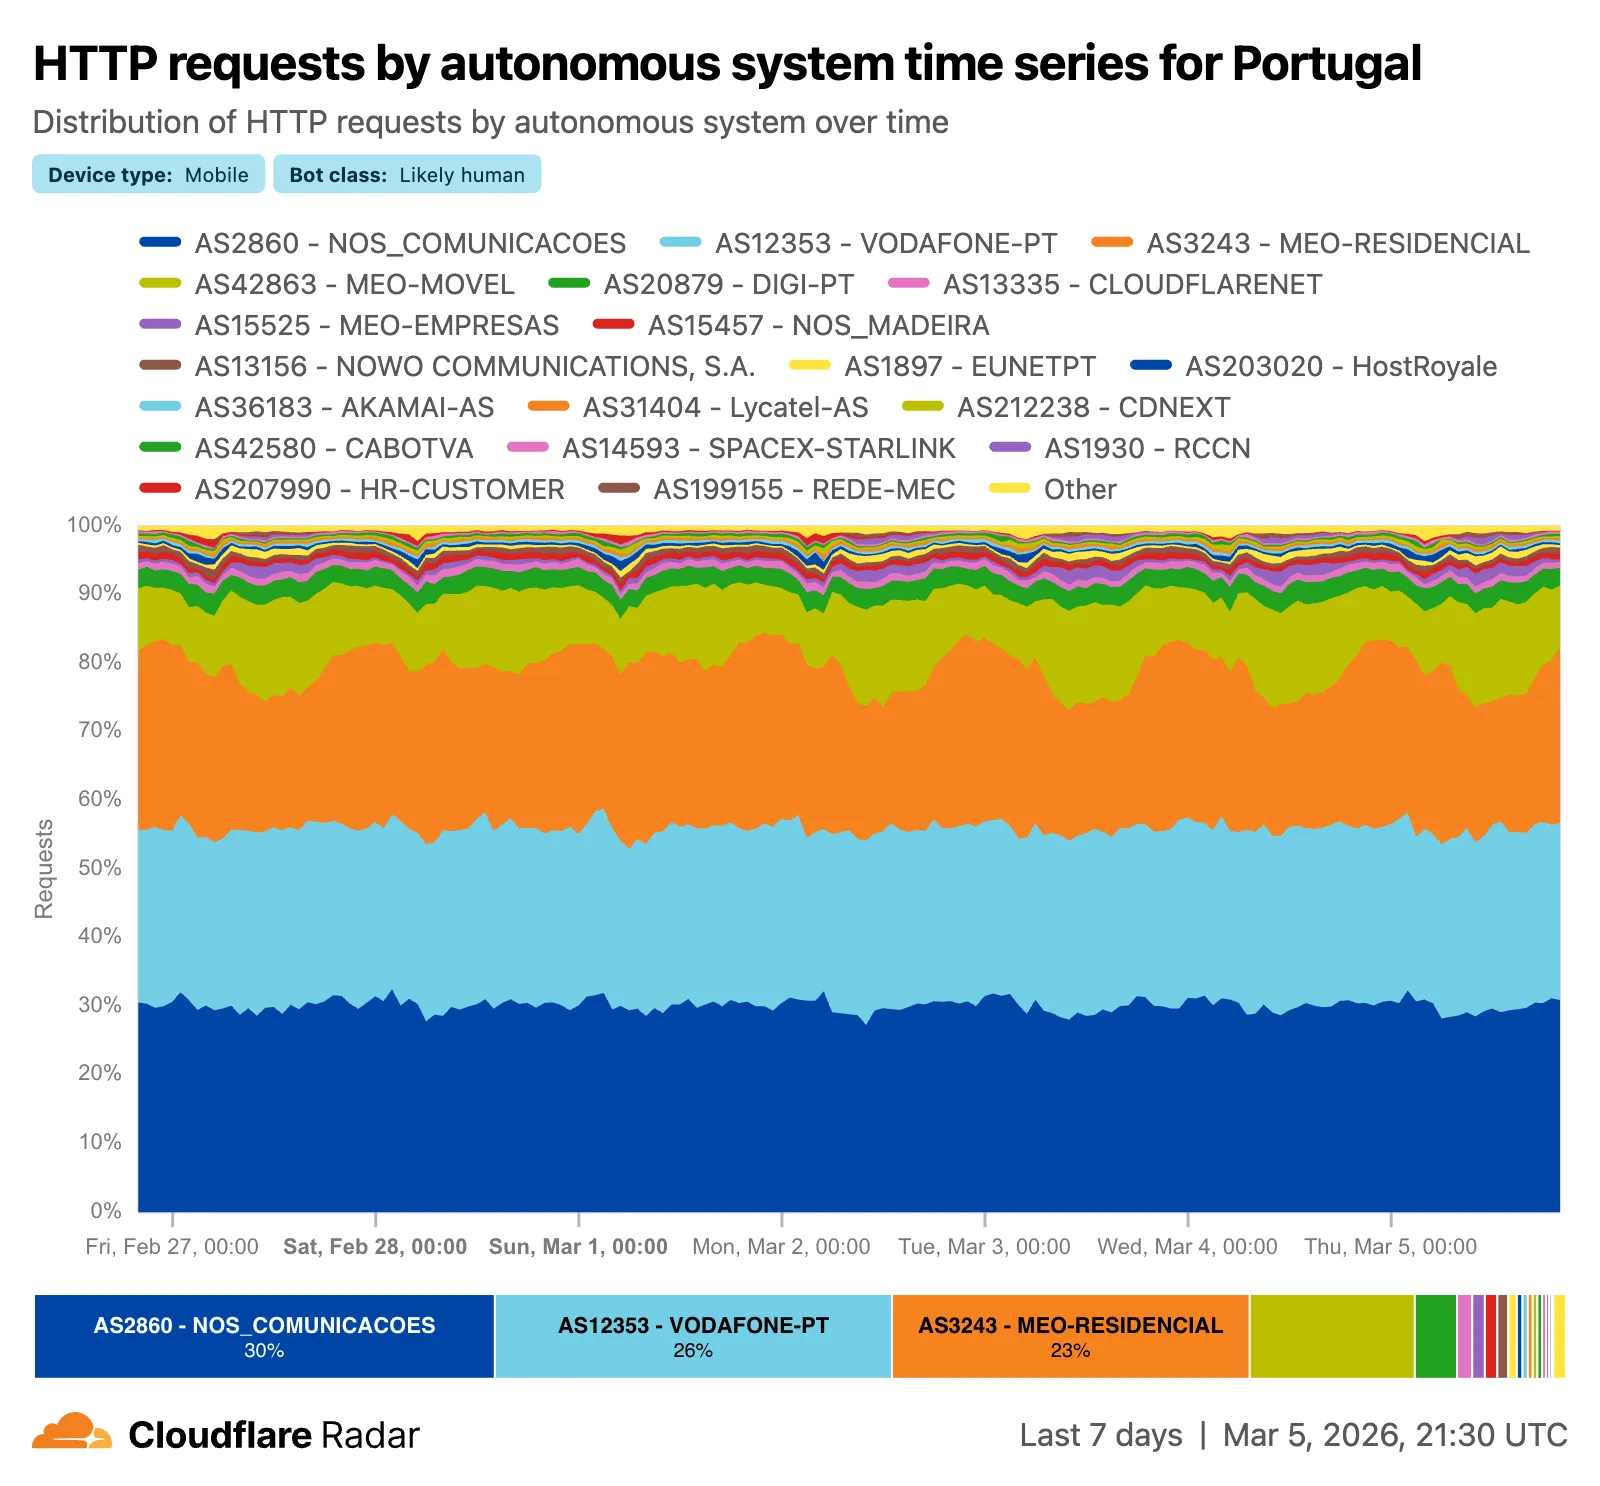
The new AS and location dimensions have also been added to the Data Explorer for the HTTP, DNS, and NetFlows datasets. Combined with other available filters, this provides a powerful tool for generating unique insights.

Screenshot of AS and location dimensions in Data Explorer

Finally, breadcrumb navigation is now available on most pages, allowing easier navigation between parent and related pages.

Check out these features on Cloudflare Radar.